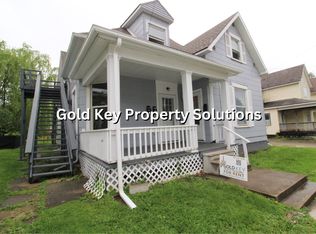
Recently updated triplex in downtown Muncie with strong income potential. Property includes three units: Unit 1 is renting for $775, unit 2 rents for $725 and unit 3 rents for $725 for a total of $2,225 per month of cash flow! Convenient downtown location with consistent rental demand. Ideal opportunity for investors seeking immediate and stable cash flow.
Active
$165,000
907 W Main St, Muncie, IN 47305
5beds
3baths
--sqft
Multi Family, Triplex
Built in 1904
-- sqft lot
$-- Zestimate®
$--/sqft
$-- HOA
What's special
- 41 days
- 134
- 17
Zillow last checked:
Listing updated:
Listed by:
Peyton Nichols peyton@propertieswithpeyton.com,
RE/MAX Real Estate Solutions
Source: MIBOR as distributed by MLS GRID,MLS#: 22082358
Facts & features
Interior
Bedrooms & bathrooms
- Bedrooms: 5
- Bathrooms: 3
Features
- Has basement: Yes
Property
Lot
- Size: 6,969 Square Feet
Details
- Parcel number: 181109458002000003
Construction
Type & style
- Home type: MultiFamily
- Property subtype: Multi Family, Triplex
Condition
- New construction: No
- Year built: 1904
Community & HOA
Community
- Subdivision: No Subdivision
Location
- Region: Muncie
Financial & listing details
- Tax assessed value: $80,900
- Annual tax amount: $1,364
- Date on market: 2/2/2026
- Cumulative days on market: 223 days
Estimated market value
Not available
Estimated sales range
Not available
Not available
Price history
| Date | Event | Price |
|---|---|---|
| 9/21/2026 | Listed for sale | $165,000 |
Source:  MIBOR as distributed by MLS GRID #22082358 Report a problem | ||
| 8/29/2026 | Listing removed | $165,000 |
Source: MIBOR as distributed by MLS GRID #22082358 Report a problem | ||
| 5/28/2026 | Listed for sale | $165,000 |
Source: MIBOR as distributed by MLS GRID #22082358 Report a problem | ||
| 5/12/2026 | Pending sale | $165,000 |
Source: MIBOR as distributed by MLS GRID #22082358 Report a problem | ||
| 2/3/2026 | Listed for sale | $165,000-88.5% |
Source: MIBOR as distributed by MLS GRID #22082358 Report a problem | ||
| 2/11/2025 | Listing removed | $1,435,000 |
Source:  IRMLS #202503116 Report a problem | ||
| 1/31/2025 | Listed for sale | $1,435,000 |
Source: IRMLS #202503116 Report a problem | ||
Public tax history
| Year | Property taxes | Tax assessment |
|---|---|---|
| 2025 | $1,256 +20.1% | $80,900 +28.8% |
| 2024 | $1,046 +5.2% | $62,800 +20.1% |
| 2023 | $994 +34% | $52,300 +5.2% |
| 2022 | $742 +3.3% | $49,700 +34% |
| 2021 | $718 0% | $37,100 +3.3% |
| 2020 | $718 +4.1% | $35,900 |
| 2019 | $690 -14.8% | $35,900 +4.1% |
| 2018 | $810 | $34,500 -1.7% |
| 2017 | $810 +25.8% | $35,100 |
| 2016 | $644 -10.1% | $35,100 +27.6% |
| 2014 | $716 +29.8% | $27,500 +3.8% |
| 2013 | $552 -2.5% | $26,500 -6.4% |
| 2012 | $566 -8.4% | $28,300 -8.4% |
| 2011 | $618 -24.4% | $30,900 -24.4% |
| 2010 | $818 -25.6% | $40,900 -25.6% |
| 2009 | $1,100 | $55,000 |
Find assessor info on the county website
Monthly payment
Est. payment
Payment breakdown
Explore the cost of this home by adjusting the details. Changes won't be saved.Climate risks
Neighborhood: Old West End


Similar homes
- $144,9992 bd2 ba-- sqft212 N Elm St, Muncie, IN 47305Active
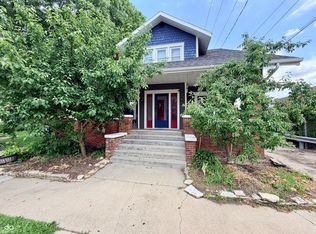 MLS ID #22106494, Candice Childs, Scott Estates. MIBOR as distributed by MLS GRID
- $165,0003 bd1 ba2.6k sqft1105 N Wheeling Ave, Muncie, IN 47303For Sale
 MLS ID #202624908, Lucius Conner, Viking Realty. IRMLS
- $149,9003 bd2 ba1k sqft3701 N Linden St, Muncie, IN 47304For Sale
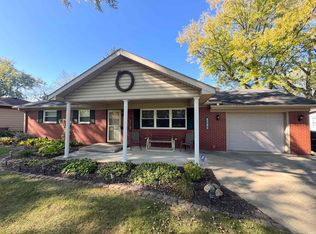 MLS ID #202644814, Steven Robillard, Burke Realty. IRMLS
- $159,9002 bd1 ba2k sqft301 N Light St, Muncie, IN 47303For Sale
 MLS ID #202634823, Rickie Sipe, Property House. IRMLS
