Welcome to 908 11th St NE — a bright, sunny end-unit row house in the heart of the vibrant H Street Corridor, offering updated living plus income-producing flexibility. This fully renovated (2011) property features two distinct, self-contained units, perfect for owner-occupants looking to offset their mortgage or investors seeking immediate cash flow. Income-Producing from Day One: The English basement ADU is leased through June 2027 at $1, 750/month, providing instant, reliable income and locked-in stability for a new owner. Live Up, Rent Down — or Rent Both! The upper unit is currently vacant, with market rents ranging from $3, 800–$4, 000/month. Move in and let the basement tenant help cover your mortgage, or rent out both levels for maximum ROI—combined income potential reaches $5, 750/month. Upper Unit: 3BR/2.5BA — Totally renovated in 2011. Eat-in gourmet kitchen w/ gas stove, separate dining room, living room w/ gas fireplace & half bath. Primary suite features a wall of closets and an en-suite with a shower stall & double sinks. Back bedroom opens to a private balcony; third bedroom/office includes built-in shelves. Tiled hall bath, hardwood floors, recessed lighting, ceiling fans, skylights, in-unit W/D, attic storage, and tankless hot water. Fully separated from the lower unit—original interior stairs removed during the remodel for complete privacy. Lower Unit: 1BR/1BA English Basement ADU — Modern, fully renovated (2011) with updated kitchen (gas stove), updated bath, and in-unit W/D—highly desirable for tenants. Shared Outdoor Space: Landscaped patio and welcoming front common area. Prime Location: Walk Score 94 / Bike Score 92. Blocks from Union Market, Union Station, Whole Foods, Ben's Chili Bowl, Danu, Stable & Cane. Whether you're expanding your portfolio or want to live in one unit while renting the other, 908 11th St NE delivers location, updated finishes, and income potential that today's market demands. Schedule your showing today! Buyer to verify all rental income, lease terms, square footage, and property details independently.
Coming soon
$1,000,000
908 11th ST NE, Washington, DC 20002
4beds
--baths
2,377sqft
Single Family Residence
Built in 1908
-- sqft lot
$1,035,400 Zestimate®
$421/sqft
$-- HOA
What's special
- 7 days
- 89
- 6
Zillow last checked:
Listing updated:
Listed by:
eXp Realty
Source: eXp Realty,MLS#: 24067
Facts & features
Interior
Bedrooms & bathrooms
- Bedrooms: 4
- Full bathrooms: 3
- 1/2 bathrooms: 1
- Main level bathrooms: 1
Appliances
- Included: Dishwasher, Disposal, Dryer, Free-Standing Gas Range, Free-Standing Refrigerator, Microwave, Range Hood, Refrigerator, Tankless Water Heater, Washer
Features
- Flooring: Bamboo, Hardwood, Tile
- Basement: Apartment, French Drain, Sump Pump
- Number of fireplaces: 1
- Fireplace features: Gas Log
Interior area
- Total interior livable area: 2,377 sqft
- Finished area below ground: 730
Property
Parking
- Parking features: On Street
Features
- Levels: Three Or More
- Stories: 3
- Patio & porch: Deck, Patio
- Exterior features: Storage, Balcony
Details
- Parcel number: 09570019
Construction
Type & style
- Home type: SingleFamily
- Property subtype: Single Family Residence
Materials
- Foundation: None
Condition
- Year built: 1908
Details
- Warranty included: Yes
Utilities & green energy
- Sewer: Public Sewer
- Water: Public
- Utilities for property: None
Community & HOA
HOA
- Has HOA: No
Location
- Region: Washington
Financial & listing details
- Price per square foot: $421/sqft
- Tax assessed value: $1,071,280
- Annual tax amount: $8,324
- Date on market: 10/24/2026
- Inclusions: Stove/range (2), microwave (2), refrigerator, dishwasher (2), disposer (2), washer and dryer in each unit (upper unit: standard washer and dryer; basement unit: single stacked washer/dryer unit), gas log, ceiling fans (3)
Estimated market value
$1,035,400
$932,000 - $1.15M
$4,751/mo
Price history
| Date | Event | Price |
|---|---|---|
| 2/28/2022 | Listing removed | -- |
Source: Zillow Rental Manager Report a problem | ||
| 2/10/2022 | Listed for rent | $3,800+5.6%$2/sqft |
Source: Zillow Rental Manager Report a problem | ||
| 2/23/2021 | Listing removed | -- |
Source: Owner Report a problem | ||
| 7/4/2020 | Listing removed | $3,600$2/sqft |
Source: Fathom Realty #DCDC470330 Report a problem | ||
| 3/23/2020 | Listed for rent | $3,600+94.6%$2/sqft |
Source: Owner Report a problem | ||
| 6/19/2019 | Listing removed | $1,850$1/sqft |
Source: Owner Report a problem | ||
| 6/11/2019 | Listed for rent | $1,850-47.1%$1/sqft |
Source: Owner Report a problem | ||
| 10/29/2018 | Listing removed | $3,500$1/sqft |
Source: RE/MAX West End #1008343722 Report a problem | ||
| 10/8/2018 | Price change | $3,500-2.8%$1/sqft |
Source: RE/MAX West End #1008343722 Report a problem | ||
| 10/4/2018 | Listed for rent | $3,600$2/sqft |
Source: RE/MAX West End #1008343722 Report a problem | ||
| 2/20/2009 | Sold | $355,000-9%$149/sqft |
Source: Public Record Report a problem | ||
| 12/24/2008 | Price change | $390,000-9.3%$164/sqft |
Source: Century 21 #DC6918337 Report a problem | ||
| 11/13/2008 | Price change | $430,000+59.3%$181/sqft |
Source: foreclosure.com Report a problem | ||
| 11/5/2008 | Listed for sale | -- |
Source: foreclosure.com Report a problem | ||
| 10/6/2008 | Sold | $270,000-5.3%$114/sqft |
Source: Public Record Report a problem | ||
| 6/13/2002 | Sold | $285,000+137.5%$120/sqft |
Source: Public Record Report a problem | ||
| 7/6/2001 | Sold | $120,000$50/sqft |
Source: Public Record Report a problem | ||
| 5/12/1997 | Sold | $120,000$50/sqft |
Source: Public Record Report a problem | ||
Public tax history
| Year | Property taxes | Tax assessment |
|---|---|---|
| 2026 | $8,324 -1.4% | $1,071,280 -1.1% |
| 2025 | $8,446 -1% | $1,083,480 -0.7% |
| 2024 | $8,532 +4.1% | $1,090,850 +4.1% |
| 2023 | $8,196 +2.3% | $1,048,210 +2.7% |
| 2022 | $8,011 +5.2% | $1,021,130 +5% |
| 2021 | $7,615 +3.8% | $972,240 +3.5% |
| 2020 | $7,339 +16.8% | $939,060 +10.4% |
| 2018 | $6,282 +9.9% | $850,820 +4.3% |
| 2017 | $5,717 +9.9% | $815,830 +9.9% |
| 2016 | $5,204 +9.9% | $742,450 +16.2% |
| 2015 | $4,733 +9.7% | $639,000 +10.6% |
| 2014 | $4,313 +7.2% | $577,580 +6.5% |
| 2013 | $4,022 +2.4% | $542,320 +2.4% |
| 2012 | $3,929 +18% | $529,740 |
| 2011 | $3,331 +27.6% | $529,740 +41.4% |
| 2010 | $2,610 -21.6% | $374,560 -12% |
| 2009 | $3,330 +216.6% | $425,560 +1.4% |
| 2007 | $1,052 +5.2% | $419,660 +33.1% |
| 2006 | $1,000 -12.3% | $315,200 +28.6% |
| 2005 | $1,140 +12% | $245,100 +40.4% |
| 2004 | $1,018 +12% | $174,570 +40% |
| 2003 | $909 -10.3% | $124,690 +18.1% |
| 2002 | $1,014 +238.9% | $105,600 +14.4% |
| 2001 | $299 | $92,324 |
Find assessor info on the county website
Monthly payment
Est. payment
Payment breakdown
Explore the cost of this home by adjusting the details. Changes won't be saved.Climate risks
Neighborhood: Near Northeast


Similar homes
- $775,0006 bd4 ba2.6k sqft1278 Morse St NE, Washington, DC 20002For Sale
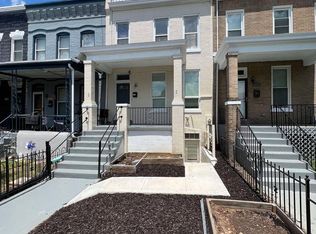
 MLS ID #DCDC2276050, Alex Burrell-Hodges, Cottage Street Realty LLC. Bright MLS
- $975,0004 bd-- ba2.4k sqft75 New York Ave NW, Washington, DC 20001For Sale
 MLS ID #DCDC2279178, Ari Firoozabadi, Greysteel Company LLC. Bright MLS
- $874,9972 bd3 ba1.9k sqft507 M St NE Unit 2, Washington, DC 20002For Sale
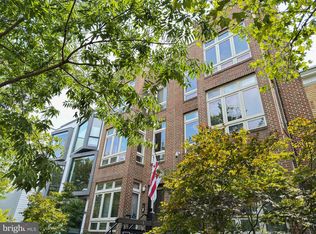 MLS ID #DCDC2268618, Gary Raze, Keller Williams Capital Properties. Bright MLS
- $675,0002 bd3 ba1.8k sqft724 13th St NE, Washington, DC 20002For Sale
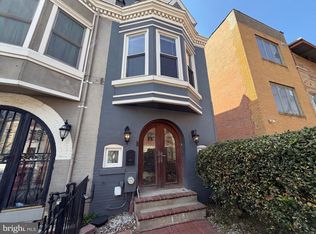 MLS ID #DCDC2282670, Darlene Morton, Jason Mitchell Group. Bright MLS
- $1,125,0005 bd4 ba2.9k sqft2427 Irving St NE, Washington, DC 20018For SaleMLS ID #DCDC2248558, Allyssa Maddox, Realty One Group Performance, LLC. Bright MLS
- $590,0004 bd2 ba1.4k sqft2005 Benning Rd NE, Washington, DC 20002For SaleMLS ID #DCDC2275904, Diego Rodriguez, Spring Hill Real Estate, LLC.. Bright MLS
- $679,0005 bd3 ba2.2k sqft1116 34th St SE, Washington, DC 20019For SaleMLS ID #DCDC2284964, Brooke Green, YAMO Premier Properties LLC. Bright MLS
- $699,9003 bd3 ba2.5k sqft1015 Urell Pl NE, Washington, DC 20017For SaleMLS ID #DCDC2278470, Farone Williams, Farone & Associates Realtors, LLC. Bright MLS
- $925,0003 bd3 ba1.7k sqftOld City 1, Washington, DC 20003For SaleMLS ID #DCDC2280636, Robert Walters, CENTURY 21 New Millennium. Bright MLS
- $875,0003 bd3 ba2.8k sqftHarbour Square, Washington, DC 20024For SaleMLS ID #DCDC2277452, Steven Gross, Welcome Home Realty, LLC. Bright MLS
- $1,025,0004 bd3 ba2.1k sqft5819 Grosvenor Ln, Bethesda, MD 20814For SaleMLS ID #MDMC2255160, John Pi, Evergreen Properties. Bright MLS
- $885,0004 bd4 ba3.4k sqft928 Madison St NW, Washington, DC 20011For SaleMLS ID #DCDC2279454, Jacob Wysor, RLAH @properties. Bright MLS
- $1,295,0005 bd5 ba3.3k sqft5529 Fairfax Dr, Arlington, VA 22205For SaleMLS ID #VAAR2081600, Coral Gundlach, RLAH @properties. Bright MLS
- $879,7005 bd3 ba2.6k sqft3919 Gallows Rd, Annandale, VA 22003For SaleMLS ID #VAFX2346236, Ronnie Molina, Weichert, REALTORS. Bright MLS
- $899,0004 bd2 ba1.7k sqft7601 Rudyard St, Falls Church, VA 22043For SaleMLS ID #VAFX2318738, Ron Luna, Coldwell Banker Realty. Bright MLS
- $565,0005 bd4 ba2.5k sqft4818 Sheriff Rd NE, Washington, DC 20019For SaleMLS ID #DCDC2261042, Joe Hawkins, Hawkins Real Estate Services. Bright MLS
- $1,173,2504 bd6 ba3.3k sqft3517 10th St NW, Washington, DC 20010For SaleMLS ID #DCDC2278386, Deneen Swann, EXP Realty, LLC. Bright MLS
- $949,9005 bd5 ba2.7k sqft51 Q St NW, Washington, DC 20001For SaleMLS ID #DCDC2267128, Donovan Green, Fairfax Realty Premier. Bright MLS
- $880,0004 bd4 ba2.4k sqft15324 Brandywine Rd, Brandywine, MD 20613For SaleMLS ID #MDPG2215776, Tiffani Rajamani, Bennett Realty Solutions. Bright MLS
- $600,0004 bd4 ba2k sqft5111 7th St NW, Washington, DC 20011For SaleMLS ID #DCDC2288656, Mr. Shanu Srivastava, Douglas Realty, LLC. Bright MLS
