$215,300
-- bd|-- ba|-- sqft
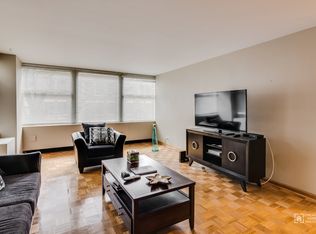
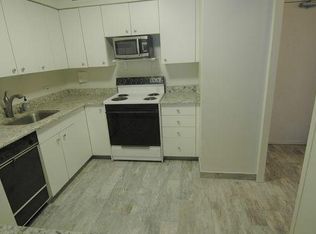
30 E Elm St APT 3A, Chicago, IL 60611
Off Market
Zillow last checked:
Elizabeth Miszczyszyn (773)419-2864,
Real Broker LLC
Not available
Estimated sales range
Not available
Not available
| Date | Event | Price |
|---|---|---|
| 10/30/2020 | Listing removed | $230,000$307/sqft |
Source: daprile properties #10774971 Report a problem | ||
| 7/9/2020 | Listed for sale | $230,000+15.1%$307/sqft |
Source: daprile properties #10774971 Report a problem | ||
| 9/19/2018 | Listing removed | $2,000$3/sqft |
Source: J-Hancok Report a problem | ||
| 9/15/2018 | Price change | $2,000-24.5%$3/sqft |
Source: J-Hancok Report a problem | ||
| 8/14/2018 | Listed for rent | $2,650+76.7%$4/sqft |
Source: @properties - Bucktown Report a problem | ||
| 6/5/2015 | Sold | $199,900$267/sqft |
Source: | ||
| 4/17/2015 | Pending sale | $199,900$267/sqft |
Source: @properties #08845205 Report a problem | ||
| 3/14/2015 | Price change | $199,900-2.4%$267/sqft |
Source: @properties #08845205 Report a problem | ||
| 2/24/2015 | Listed for sale | $204,900+12509.2%$273/sqft |
Source: @properties #08845205 Report a problem | ||
| 2/13/2015 | Listing removed | $1,500$2/sqft |
Source: Exit Strategy Realty Report a problem | ||
| 1/14/2015 | Listed for rent | $1,500-3.2%$2/sqft |
Source: EXIT Strategy Realty Report a problem | ||
| 5/20/2014 | Sold | $1,625-97.8%$2/sqft |
Source: Agent Provided Report a problem | ||
| 9/19/2011 | Listing removed | $1,550$2/sqft |
Source: Brian Merrion and Dan Merrion Report a problem | ||
| 9/16/2011 | Price change | $1,550-3.1%$2/sqft |
Source: Brian Merrion and Dan Merrion Report a problem | ||
| 8/27/2011 | Listed for rent | $1,600$2/sqft |
Source: Brian Merrion and Dan Merrion Report a problem | ||
| 6/11/1998 | Sold | $74,000$99/sqft |
Source: Public Record Report a problem | ||
| Year | Property taxes | Tax assessment |
|---|---|---|
| 2024 | -- | $19,542 +4.6% |
| 2023 | $3,241 +3.3% | $18,676 |
| 2022 | $3,138 -12.1% | $18,676 -11.4% |
| 2021 | $3,569 +17.8% | $21,080 +26.2% |
| 2020 | $3,029 -16.8% | $16,701 -7.8% |
| 2019 | $3,641 +1.7% | $18,123 |
| 2018 | $3,580 +3.5% | $18,123 +12.8% |
| 2017 | $3,460 +7.5% | $16,072 |
| 2016 | $3,219 +9.3% | $16,072 |
| 2015 | $2,945 +18.5% | $16,072 +20% |
| 2014 | $2,485 +2% | $13,396 |
| 2013 | $2,436 -10.1% | $13,396 -11.3% |
| 2012 | $2,711 +27.2% | $15,109 -9.9% |
| 2011 | $2,132 +9.9% | $16,765 |
| 2010 | $1,939 -3.6% | $16,765 -11% |
| 2009 | $2,012 +20% | $18,837 +2.3% |
| 2008 | $1,677 +12.6% | $18,405 |
| 2007 | $1,489 +0.8% | $18,405 |
| 2006 | $1,477 -5.1% | $18,405 +13.3% |
| 2005 | $1,558 +1.9% | $16,246 |
| 2004 | $1,528 -40.5% | $16,246 |
| 2003 | $2,571 +37.2% | $16,246 +55.7% |
| 2002 | $1,874 +28.7% | $10,433 |
| 2001 | $1,456 +42.1% | $10,433 |
| 2000 | $1,025 +0% | $10,433 +42.3% |
| 1999 | $1,024 | $7,333 |
Source: MRED as distributed by MLS GRID. This data may not be complete. We recommend contacting the local school district to confirm school assignments for this home.
A local agent can set up tours, give advice and negotiate with sellers.
A local lender can help you make sure your offer is ready when you are.