$316,400
3 bd|2 ba|1.7k sqft
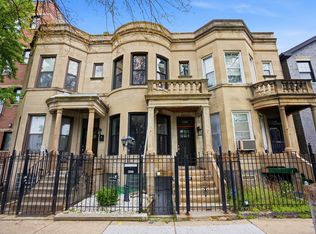
4839 S Vincennes Ave APT 2, Chicago, IL 60615
Off Market

Zillow last checked:
Marjorie Tatum 312-216-2422,
Keller Williams ONEChicago
$464,200
$441,000 - $487,000
$3,698/mo
| Date | Event | Price |
|---|---|---|
| 4/12/2016 | Sold | $272,500$109/sqft |
Source: | ||
| 2/22/2016 | Pending sale | $272,500$109/sqft |
Source: Jameson Sotheby's International Realty #09126993 Report a problem | ||
| 10/10/2015 | Price change | $272,500-0.9%$109/sqft |
Source: Coldwell Banker Residential Brokerage - Hyde Park #09006504 Report a problem | ||
| 9/5/2015 | Listed for sale | $274,900$110/sqft |
Source: Coldwell Banker Residential Brokerage - Hyde Park #09006504 Report a problem | ||
| 9/1/2015 | Pending sale | $274,900$110/sqft |
Source: Coldwell Banker Residential Brokerage - Hyde Park #09006504 Report a problem | ||
| 8/9/2015 | Listed for sale | $274,900+7.8%$110/sqft |
Source: Coldwell Banker Residential Brokerage - Hyde Park #09006504 Report a problem | ||
| 6/22/2012 | Sold | $255,000$102/sqft |
Source: | ||
| 5/19/2012 | Price change | $255,000-14.7%$102/sqft |
Source: Coldwell Banker Residential Brokerage - Hyde Park #07925975 Report a problem | ||
| 3/18/2012 | Price change | $299,000-9.1%$120/sqft |
Source: Coldwell Banker Residential Brokerage - Hyde Park #07925975 Report a problem | ||
| 10/19/2011 | Listed for sale | $329,000-5.7%$132/sqft |
Source: Coldwell Banker Residential Brokerage - Hyde Park #07925975 Report a problem | ||
| 8/20/2011 | Listing removed | $349,000$140/sqft |
Source: Coldwell Banker Residential Brokerage - Hyde Park #06857640 Report a problem | ||
| 5/11/2011 | Listed for sale | $349,000+83.7%$140/sqft |
Source: Coldwell Banker Residential Brokerage - Hyde Park #06857640 Report a problem | ||
| 3/27/2000 | Sold | $190,000$76/sqft |
Source: Agent Provided Report a problem | ||
| Year | Property taxes | Tax assessment |
|---|---|---|
| 2024 | -- | $37,314 +6.6% |
| 2023 | $6,707 -7.1% | $34,999 |
| 2022 | $7,221 +2.3% | $34,999 |
| 2021 | $7,059 +33.5% | $34,999 +47.4% |
| 2020 | $5,289 +0.6% | $23,742 -9.3% |
| 2019 | $5,259 +1.7% | $26,178 |
| 2018 | $5,171 -4.9% | $26,178 +3.6% |
| 2017 | $5,438 +7.5% | $25,261 |
| 2016 | $5,060 +9.3% | $25,261 |
| 2015 | $4,629 +6.2% | $25,261 +7.5% |
| 2014 | $4,360 +2% | $23,498 |
| 2013 | $4,274 -25% | $23,498 -26% |
| 2012 | $5,699 +10.3% | $31,759 -0.4% |
| 2011 | $5,168 -0.4% | $31,892 |
| 2010 | $5,190 +4.4% | $31,892 |
| 2009 | $4,973 | $31,892 |
Source: MRED as distributed by MLS GRID. This data may not be complete. We recommend contacting the local school district to confirm school assignments for this home.
A local agent can set up tours, give advice and negotiate with sellers.
A local lender can help you make sure your offer is ready when you are.