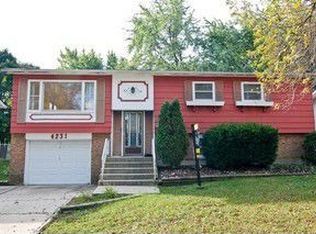
$246,900
3 bd|3 ba|1.3k sqft
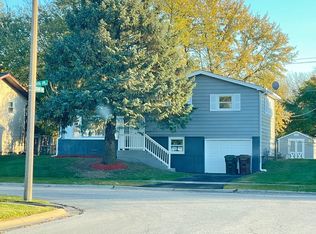
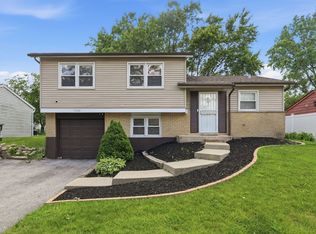
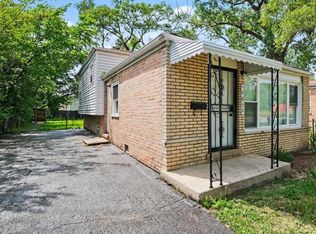
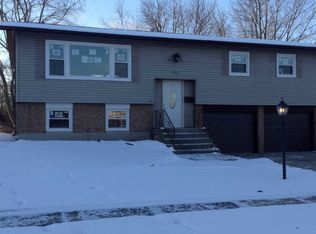
4261 190th Pl, Country Club Hills, IL 60478
Off Market
Zillow last checked:
Listing updated:
Khayyan Valentine-Johnson 815-221-8400,
Century 21 IMPACT
$170,300
$162,000 - $179,000
$2,318/mo
| Date | Event | Price |
|---|---|---|
| 6/25/2026 | Price change | $173,000-6.5%$150/sqft |
Source: | ||
| 4/25/2026 | Listed for sale | $185,000-5.1%$161/sqft |
Source: | ||
| 1/1/2026 | Listing removed | $195,000$169/sqft |
Source: | ||
| 11/18/2025 | Listed for sale | $195,000-2.5%$169/sqft |
Source: | ||
| 11/9/2025 | Listing removed | $200,000$174/sqft |
Source: | ||
| 11/5/2025 | Price change | $200,000-2.4%$174/sqft |
Source: | ||
| 10/7/2025 | Price change | $205,000-2.4%$178/sqft |
Source: | ||
| 10/2/2025 | Price change | $210,000-2.3%$182/sqft |
Source: | ||
| 9/28/2025 | Listed for sale | $215,000+43.3%$187/sqft |
Source: | ||
| 6/2/2025 | Listing removed | $149,999$130/sqft |
Source: | ||
| 5/29/2025 | Listed for sale | $149,999-25%$130/sqft |
Source: | ||
| 5/6/2021 | Sold | $200,000$174/sqft |
Source: | ||
| 4/21/2021 | Pending sale | $200,000$174/sqft |
Source: | ||
| 2/24/2021 | Contingent | $200,000$174/sqft |
Source: | ||
| 2/19/2021 | Listed for sale | $200,000+90.5%$174/sqft |
Source: | ||
| 11/25/2020 | Sold | $105,000-12.5%$91/sqft |
Source: | ||
| 10/1/2020 | Pending sale | $120,000$104/sqft |
Source: Charles Rutenberg Realty of IL #10883647 Report a problem | ||
| 9/27/2020 | Listed for sale | $120,000$104/sqft |
Source: Charles Rutenberg Realty of IL #10883647 Report a problem | ||
| 7/14/2003 | Sold | $120,000$104/sqft |
Source: Public Record Report a problem | ||
| Year | Property taxes | Tax assessment |
|---|---|---|
| 2024 | -- | $16,000 +0% |
| 2023 | $5,482 +176.7% | $15,999 +83.6% |
| 2022 | $1,981 -70.8% | $8,712 |
| 2021 | $6,790 +55.6% | $8,712 |
| 2020 | $4,365 -19.5% | $8,712 -15.1% |
| 2019 | $5,420 +5.5% | $10,258 |
| 2018 | $5,136 +2.1% | $10,258 |
| 2017 | $5,028 -16.4% | $10,258 -6.7% |
| 2016 | $6,012 +4% | $10,990 |
| 2015 | $5,784 +1.2% | $10,990 |
| 2014 | $5,717 +4% | $10,990 -4.8% |
| 2013 | $5,497 +2.4% | $11,549 |
| 2012 | $5,366 +2.9% | $11,549 |
| 2011 | $5,213 -3.8% | $11,549 -19.8% |
| 2010 | $5,418 +13.9% | $14,404 |
| 2009 | $4,757 +9.4% | $14,404 -5% |
| 2008 | $4,347 -17.9% | $15,162 +14.7% |
| 2007 | $5,292 +16.6% | $13,216 |
| 2006 | $4,538 +0.1% | $13,216 |
| 2005 | $4,534 +14.1% | $13,216 +16.3% |
| 2004 | $3,973 +1.2% | $11,360 |
| 2003 | $3,925 +26.9% | $11,360 |
| 2002 | $3,092 +21.3% | $11,360 +19.5% |
| 2001 | $2,550 +8.9% | $9,506 |
| 2000 | $2,343 +5.4% | $9,506 |
| 1999 | $2,223 | $9,506 |
Source: MRED as distributed by MLS GRID. This data may not be complete. We recommend contacting the local school district to confirm school assignments for this home.
A local agent can set up tours, give advice and negotiate with sellers.