$288,100
-- bd|3 ba|1.6k sqft
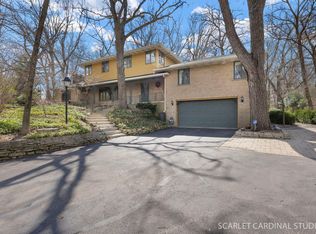
50 Woodland Ave, Elgin, IL 60123
Off Market
Zillow last checked:
Donald Driessen 773-791-8134,
Fathom Realty IL
$575,300
$547,000 - $604,000
$4,469/mo
| Date | Event | Price |
|---|---|---|
| 6/5/2026 | Listing removed | $584,900$104/sqft |
Source: MRED as distributed by MLS GRID #12650637 Report a problem | ||
| 5/21/2026 | Price change | $584,9000%$104/sqft |
Source: MRED as distributed by MLS GRID #12650637 Report a problem | ||
| 5/18/2026 | Listed for sale | $585,000$104/sqft |
Source: MRED as distributed by MLS GRID #12650637 Report a problem | ||
| 5/7/2026 | Listing removed | $585,000$104/sqft |
Source: | ||
| 4/29/2026 | Price change | $585,000-5.3%$104/sqft |
Source: | ||
| 3/21/2026 | Price change | $617,6000%$110/sqft |
Source: | ||
| 3/7/2026 | Price change | $617,7000%$110/sqft |
Source: | ||
| 2/27/2026 | Price change | $617,8000%$110/sqft |
Source: | ||
| 2/12/2026 | Listed for sale | $617,900-4.7%$110/sqft |
Source: | ||
| 2/12/2026 | Listing removed | $648,700$115/sqft |
Source: | ||
| 2/5/2026 | Price change | $648,700-0.2%$115/sqft |
Source: | ||
| 12/28/2025 | Price change | $649,7000%$116/sqft |
Source: | ||
| 11/28/2025 | Price change | $649,9000%$116/sqft |
Source: | ||
| 11/6/2025 | Price change | $649,999-4.4%$116/sqft |
Source: | ||
| 9/10/2025 | Listed for sale | $680,000+38.8%$121/sqft |
Source: | ||
| 6/13/2022 | Sold | $490,000-20.9%$87/sqft |
Source: | ||
| 3/22/2022 | Price change | $619,500-8.2%$110/sqft |
Source: | ||
| 2/24/2022 | Listed for sale | $675,000+200%$120/sqft |
Source: | ||
| 2/20/1997 | Sold | $225,000$40/sqft |
Source: Public Record Report a problem | ||
| Year | Property taxes | Tax assessment |
|---|---|---|
| 2024 | $12,166 +4.5% | $160,027 +10.7% |
| 2023 | $11,642 +20.6% | $144,572 +18.2% |
| 2022 | $9,654 +4.7% | $122,336 +7% |
| 2021 | $9,223 +3% | $114,376 +4.8% |
| 2020 | $8,955 -7.8% | $109,189 +5% |
| 2019 | $9,714 +0.3% | $104,009 +6.2% |
| 2018 | $9,687 +1.7% | $97,983 +5.8% |
| 2017 | $9,527 +4% | $92,629 +7.8% |
| 2016 | $9,165 | $85,935 +9.1% |
| 2015 | -- | $78,767 +1.2% |
| 2014 | -- | $77,795 -2.6% |
| 2013 | -- | $79,847 -18.6% |
| 2012 | -- | $98,052 -6% |
| 2011 | -- | $104,357 -9.6% |
| 2010 | -- | $115,503 -6.7% |
| 2009 | -- | $123,824 |
| 2008 | -- | $123,824 +3.3% |
| 2007 | -- | $119,845 +4.2% |
| 2006 | -- | $115,026 +6.5% |
| 2005 | -- | $108,016 +6.8% |
| 2004 | -- | $101,176 +7.8% |
| 2003 | -- | $93,864 +8% |
| 2002 | -- | $86,911 +7.5% |
| 2001 | -- | $80,885 +5.1% |
| 2000 | -- | $76,974 |
Source: MRED as distributed by MLS GRID. This data may not be complete. We recommend contacting the local school district to confirm school assignments for this home.
A local agent can set up tours, give advice and negotiate with sellers.
A local lender can help you make sure your offer is ready when you are.