$--
-- bd|-- ba|-- sqft
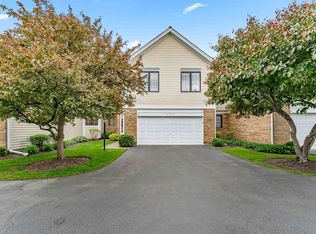
30908 N Pinehurst Ct, Libertyville, IL 60048
Off Market
Likely to sell faster than
Zillow last checked:
Listing updated:
Lori Rowe 847-774-7464,
Coldwell Banker Realty
Not available
Estimated sales range
Not available
Not available
| Date | Event | Price |
|---|---|---|
| 6/17/2026 | Contingent | $555,000$246/sqft |
Source: | ||
| 6/9/2026 | Listed for sale | $555,000+29.1%$246/sqft |
Source: | ||
| 9/18/2017 | Listing removed | $429,900$191/sqft |
Source: CENTURY 21 Affiliated #09680516 Report a problem | ||
| 8/4/2017 | Price change | $429,900-1.1%$191/sqft |
Source: CENTURY 21 Affiliated #09680516 Report a problem | ||
| 7/17/2017 | Price change | $434,900-3.3%$193/sqft |
Source: CENTURY 21 Affiliated #09680516 Report a problem | ||
| 7/7/2017 | Listed for sale | $449,900+13.9%$200/sqft |
Source: CENTURY 21 Affiliated #09680516 Report a problem | ||
| 7/1/2016 | Sold | $395,000-1.3%$175/sqft |
Source: Public Record Report a problem | ||
| 5/15/2016 | Pending sale | $400,000$178/sqft |
Source: Coldwell Banker Residential Brokerage - Libertyville #09217058 Report a problem | ||
| 5/6/2016 | Listed for sale | $400,000+38.4%$178/sqft |
Source: Coldwell Banker Residential Brokerage - Libertyville #09217058 Report a problem | ||
| 6/26/1995 | Sold | $289,000$128/sqft |
Source: Public Record Report a problem | ||
| Year | Property taxes | Tax assessment |
|---|---|---|
| 2023 | $11,811 +9% | $171,713 +8.4% |
| 2022 | $10,838 +12.7% | $158,378 +9.1% |
| 2021 | $9,614 +4% | $145,146 +12.3% |
| 2020 | $9,243 +2.6% | $129,290 +1% |
| 2019 | $9,010 +4.5% | $128,061 -0.9% |
| 2018 | $8,625 | $129,252 +3.3% |
| 2017 | $8,625 +10.1% | $125,171 +5.5% |
| 2016 | $7,834 +1.1% | $118,679 +7% |
| 2015 | $7,752 -9.6% | $110,925 +1.4% |
| 2014 | $8,573 +0.3% | $109,437 -9.8% |
| 2012 | $8,544 +4% | $121,307 -6.4% |
| 2011 | $8,218 +0.7% | $129,538 -4% |
| 2010 | $8,164 +3.3% | $134,935 -4.6% |
| 2009 | $7,900 -9.6% | $141,492 -9.2% |
| 2008 | $8,735 +7.8% | $155,845 +3.5% |
| 2006 | $8,101 -2.2% | $150,517 |
| 2005 | $8,280 +8.4% | -- |
| 2004 | $7,635 -2.3% | -- |
| 2003 | $7,811 +11.2% | -- |
| 2002 | $7,024 +5% | -- |
| 2001 | $6,690 +2.9% | $97,567 +2.6% |
| 2000 | $6,502 | $95,104 |
Source: MRED as distributed by MLS GRID. This data may not be complete. We recommend contacting the local school district to confirm school assignments for this home.
A local agent can set up tours, give advice and negotiate with sellers.
A local lender can help you make sure your offer is ready when you are.