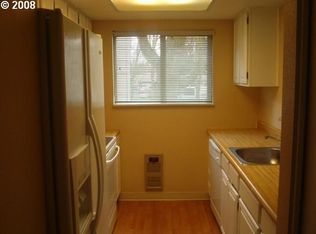
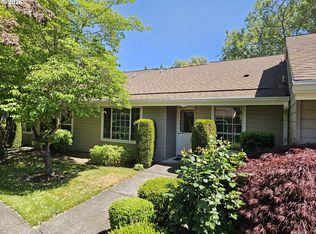
This 1016 square foot condo home has 2 bedrooms and 1.0 bathrooms. This home is located at 10163 SW Trapper Ter, Beaverton, OR 97008.
Foreclosed
Est. $231,700
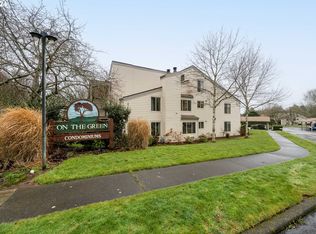
10163 SW Trapper Ter, Beaverton, OR 97008
2beds
1baths
1,016sqft
Condo
Built in 1979
-- sqft lot
$231,700 Zestimate®
$228/sqft
$360/mo HOA
Overview
- 107 days |
- 20 |
- 0 |
Facts & features
Interior
Bedrooms & bathrooms
- Bedrooms: 2
- Bathrooms: 1
Heating
- Baseboard
Features
- Has fireplace: Yes
Interior area
- Total interior livable area: 1,016 sqft
Property
Features
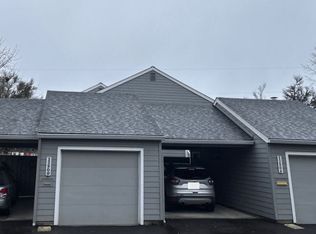
- Exterior features: Other
Details
- Parcel number: 1S134BA91801
Construction
Type & style
- Home type: Condo
Materials
- wood frame
- Roof: Shake / Shingle
Condition
- Year built: 1979
Community & HOA
HOA
- Has HOA: Yes
- HOA fee: $360 monthly
Location
- Region: Beaverton
Financial & listing details
- Price per square foot: $228/sqft
- Tax assessed value: $269,010
- Annual tax amount: $2,997
Visit our professional directory to find a foreclosure specialist in your area that can help with your home search.
Find a foreclosure agentForeclosure details
Estimated market value
$231,700
$211,000 - $253,000
$1,650/mo
Price history
| Date | Event | Price |
|---|---|---|
| 3/12/2026 | Sold | $192,400-34.8%$189/sqft |
Source: Public Record Report a problem | ||
| 3/4/2022 | Sold | $295,000+9.3%$290/sqft |
Source: | ||
| 2/4/2022 | Pending sale | $270,000$266/sqft |
Source: | ||
| 2/2/2022 | Listed for sale | $270,000$266/sqft |
Source: | ||
Public tax history
| Year | Property taxes | Tax assessment |
|---|---|---|
| 2025 | $2,997 +4.1% | $136,420 +3% |
| 2024 | $2,878 +5.9% | $132,450 +3% |
| 2023 | $2,718 +4.5% | $128,600 +3% |
| 2022 | $2,601 +3.6% | $124,860 |
| 2021 | $2,510 +3.1% | -- |
| 2020 | $2,434 +3.3% | $117,700 +3% |
| 2019 | $2,357 +3.3% | $114,280 |
| 2018 | $2,282 | $114,280 +6.1% |
| 2017 | $2,282 +11% | $107,730 +3% |
| 2016 | $2,057 | $104,600 +3% |
| 2015 | $2,057 +9.5% | $101,560 +3% |
| 2014 | $1,878 +29.3% | $98,610 +27.2% |
| 2013 | $1,453 +10.6% | $77,500 +10.3% |
| 2012 | $1,313 -21.5% | $70,250 -21.5% |
| 2011 | $1,672 -7.8% | $89,470 -23.9% |
| 2010 | $1,814 +2.3% | $117,570 -5% |
| 2009 | $1,773 +8.3% | $123,760 -16% |
| 2008 | $1,637 +1% | $147,390 +2.1% |
| 2007 | $1,621 +10.1% | $144,360 +18.3% |
| 2006 | $1,472 -3.9% | $122,020 +24% |
| 2005 | $1,533 +6.2% | $98,440 +5.5% |
| 2004 | $1,443 +0.4% | $93,320 +3.9% |
| 2003 | $1,436 +8.6% | $89,840 +4.9% |
| 2002 | $1,323 +4.8% | $85,640 -0.5% |
| 2001 | $1,262 | $86,090 |
Find assessor info on the county website
Monthly payment
Estimated monthly payment$1,822
All calculations are estimates and provided by Zillow, Inc. for informational purposes only. Actual amounts may vary.
HOA fees may include property taxes on listings classified as Co-Ops. Contact the listing agent and/or owner for fee details.
Mortgage interest rates are dependent on a number of factors, including credit score, down payment, and repayment length. Interest rate data provided by Zillow Group Marketplace, Inc. as of 1/1/1970 from various mortgage lenders with which we have lead or other similar arrangements; the Estimated Payment is an average of those rates.
See how much you could borrow to make a competitive offer.
Climate risks
Neighborhood: Greenway
Nearby schools
GreatSchools rating
- 8/10Greenway Elementary SchoolGrades: PK-5Distance: 0.5 mi
- 5/10Conestoga Middle SchoolGrades: 6-8Distance: 0.1 mi
- 5/10Southridge High SchoolGrades: 9-12Distance: 0.4 mi


- Oregon
- Washington County
- Beaverton
- 97008
- Greenway
- 10163 SW Trapper Ter
Nearby cities
Nearby neighborhoods
Nearby zip codes
Other Beaverton Topics
