This 1176 square foot single family home has 3 bedrooms and 2.0 bathrooms. This home is located at 1034 Jackson St, Saint Paul, MN 55117.
Pre-foreclosure
Est. $219,600
1034 Jackson St, Saint Paul, MN 55117
3beds
2baths
1,176sqft
SingleFamily
Built in 1875
4,730 Square Feet Lot
$219,600 Zestimate®
$187/sqft
$-- HOA
Overview
- 79 days
- 15
- 0
Facts & features
Interior
Bedrooms & bathrooms
- Bedrooms: 3
- Bathrooms: 2
Heating
- Forced air
Cooling
- None
Appliances
- Included: Microwave, Refrigerator, Washer
Features
- Basement: Partially finished
Interior area
- Total interior livable area: 1,176 sqft
Property
Parking
- Parking features: Garage - Detached
Features
- Exterior features: Vinyl
Lot
- Size: 4,730 Square Feet
Details
- Parcel number: 302922130051
- Zoning: Residential-Single
Construction
Type & style
- Home type: SingleFamily
Materials
- Roof: Asphalt
Condition
- Year built: 1875
Utilities & green energy
- Sewer: City Sewer/Connected
Community & HOA
Location
- Region: Saint Paul
Financial & listing details
- Price per square foot: $187/sqft
- Tax assessed value: $212,300
- Annual tax amount: $6,106
Foreclosure details
Estimated market value
$219,600
$206,000 - $233,000
$2,213/mo
Price history
| Date | Event | Price |
|---|---|---|
| 4/4/2023 | Sold | $195,000$166/sqft |
Source:  NorthstarMLS as distributed by MLS GRID #6315748 Report a problem | ||
| 3/28/2023 | Pending sale | $195,000$166/sqft |
Source: NorthstarMLS as distributed by MLS GRID #6315748 Report a problem | ||
| 1/23/2023 | Price change | $195,000-4.9%$166/sqft |
Source: NorthstarMLS as distributed by MLS GRID #6315748 Report a problem | ||
| 12/23/2022 | Listed for sale | $205,000+37.6%$174/sqft |
Source: NorthstarMLS as distributed by MLS GRID #6315748 Report a problem | ||
| 12/10/2018 | Sold | $149,000-0.6%$127/sqft |
Source: NorthstarMLS as distributed by MLS GRID #4998142 Report a problem | ||
| 11/12/2018 | Pending sale | $149,900$127/sqft |
Source: Edina Realty, Inc., a Berkshire Hathaway affiliate #4998142 Report a problem | ||
| 11/2/2018 | Price change | $149,900-6.3%$127/sqft |
Source: Edina Realty, Inc., a Berkshire Hathaway affiliate #4998142 Report a problem | ||
| 10/23/2018 | Price change | $159,900-5.9%$136/sqft |
Source: Edina Realty, Inc., a Berkshire Hathaway affiliate #4998142 Report a problem | ||
| 9/4/2018 | Price change | $169,900-8.1%$144/sqft |
Source: Edina Realty, Inc., a Berkshire Hathaway affiliate #4998142 Report a problem | ||
| 7/10/2018 | Listed for sale | $184,900+780.5%$157/sqft |
Source: RE/MAX Results #4977510 Report a problem | ||
| 10/28/2015 | Sold | $21,000-78.8%$18/sqft |
Source: Public Record Report a problem | ||
| 12/14/2009 | Sold | $99,000+360.5%$84/sqft |
Source: Public Record Report a problem | ||
| 11/21/2008 | Sold | $21,500$18/sqft |
Source: Public Record Report a problem | ||
Public tax history
| Year | Property taxes | Tax assessment |
|---|---|---|
| 2026 | $6,106 +23.4% | $212,300 +5.7% |
| 2025 | $4,950 +57.7% | $200,900 +7.8% |
| 2024 | $3,138 -7.7% | $186,400 -3.9% |
| 2023 | $3,398 +14.3% | $193,900 -7.5% |
| 2022 | $2,972 +16.3% | $209,600 +12.4% |
| 2021 | $2,556 +23.8% | $186,400 +11.2% |
| 2020 | $2,064 +82% | $167,600 +67.6% |
| 2019 | $1,134 | $100,000 |
| 2018 | $1,134 -12.7% | $100,000 +4.5% |
| 2017 | $1,300 | $95,700 |
| 2016 | $1,300 +2.2% | -- |
| 2015 | $1,272 +15.4% | $79,700 |
| 2014 | $1,102 +32.1% | -- |
| 2013 | $834 +5.6% | -- |
| 2012 | $790 -39.8% | -- |
| 2011 | $1,312 | -- |
| 2010 | -- | -- |
| 2009 | $2,026 +54.9% | -- |
| 2008 | $1,308 +12% | -- |
| 2007 | $1,168 +48.2% | -- |
| 2006 | $788 +13.5% | -- |
| 2005 | $694 +11.9% | -- |
| 2004 | $620 +22% | -- |
| 2003 | $508 +2.8% | -- |
| 2002 | $494 -10.5% | -- |
| 2001 | $552 +65.1% | -- |
| 2000 | $334 | -- |
Find assessor info on the county website
Monthly payment
Climate risks
Neighborhood: North End
Nearby schools
Schools provided by the listing agent
- District: St. Paul #625
Source: The MLS. This data may not be complete. We recommend contacting the local school district to confirm school assignments for this home.


Similar homes
- $239,9003 bd2 ba1.3k sqft880 Jackson St, Saint Paul, MN 55117For Sale
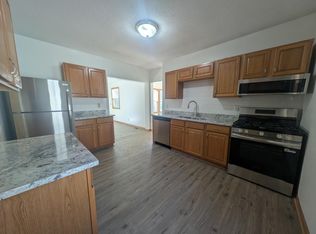
 MLS ID #7086492, JoAnn White, Ashworth Real Estate. NorthstarMLS as distributed by MLS GRID
- $239,9003 bd2 ba1.2k sqft1084 Sylvan St, Saint Paul, MN 55117For Sale
 MLS ID #7155982, McKenzie Anderson, Keller Williams Classic Rlty NW. NorthstarMLS as distributed by MLS GRID
- $210,0003 bd2 ba1.1k sqft324 Topping St, Saint Paul, MN 55117For Sale
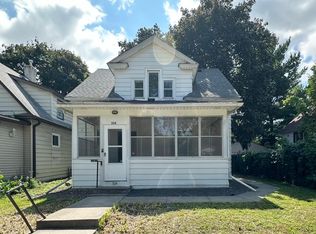 MLS ID #7158575, Panghoua Moua, Empire Realty LLC. NorthstarMLS as distributed by MLS GRID
- $--4 bd2 ba1.5k sqft983 Agate St, Saint Paul, MN 55117Auction
 ServiceLink Auction
- $235,0003 bd2 ba1.6k sqft318 Front Ave, Saint Paul, MN 55117For SaleMLS ID #7126771, Sarah Larkin Hoff, Keller Williams Premier Realty. NorthstarMLS as distributed by MLS GRID
- $225,0002 bd1 ba1k sqft1216 Danforth St, Saint Paul, MN 55117For SaleMLS ID #7111028, Reidell Estey & Associates – Marti Estey, RE/MAX Results. NorthstarMLS as distributed by MLS GRID
- $234,9002 bd2 ba934 sqft1087 Matilda St, Saint Paul, MN 55117For SaleMLS ID #7159367, Mac Lockner, RE/MAX Results. NorthstarMLS as distributed by MLS GRID
- $219,0004 bd1 ba1.1k sqft482 Lawson Ave W, Saint Paul, MN 55117For SaleMLS ID #7133988, Tyler Diedrich, Fuze Real Estate. NorthstarMLS as distributed by MLS GRID
- $192,0003 bd2 ba1.2k sqft760 Minnehaha Ave E, Saint Paul, MN 55106For SaleMLS ID #7162870, Greg E. Hilger, RE/MAX Advantage Plus. NorthstarMLS as distributed by MLS GRID
- $249,9004 bd2 ba1.5k sqft35 Manitoba Ave, Saint Paul, MN 55117For SaleMLS ID #7131285, Jose Llort, National Realty Guild. NorthstarMLS as distributed by MLS GRID
- $229,0003 bd1 ba1k sqft1037 Kent St, Saint Paul, MN 55117For SaleMLS ID #7151937, Jackeline Funk, BrBaGa. NorthstarMLS as distributed by MLS GRID
- $181,5003 bd2 ba1.7k sqft87 Cook Ave W, Saint Paul, MN 55117For SaleMLS ID #7162349, Peter F. Hao, Longhouse Realty. NorthstarMLS as distributed by MLS GRID
- $224,9004 bd2 ba1.5k sqft1070 Dale St N, Saint Paul, MN 55117For SaleMLS ID #7145428, Mac Lockner, RE/MAX Results. NorthstarMLS as distributed by MLS GRID
- $225,0003 bd2 ba1.2k sqft626 Magnolia Ave E, Saint Paul, MN 55130For SaleMLS ID #7156208, Angela M. Lapinski, Bridge Realty, LLC. NorthstarMLS as distributed by MLS GRID
- $240,0005 bd3 ba1.5k sqft85 Hatch Ave, Saint Paul, MN 55117For SaleMLS ID #7137341, Veronica D. Korby, White Oaks Real Estate, LLC. NorthstarMLS as distributed by MLS GRID
- $189,9003 bd1 ba1.1k sqft849 Woodbridge St, Saint Paul, MN 55117For SaleMLS ID #7146240, Byron J Anfinson, Coldwell Banker Realty. NorthstarMLS as distributed by MLS GRID
- $199,9003 bd1 ba1.3k sqft920 Farrington St, Saint Paul, MN 55117For SaleMLS ID #7124198, Nicole L Stone, RE/MAX Results. NorthstarMLS as distributed by MLS GRID
- $209,9003 bd1 ba1k sqft1125 Farrington St, Saint Paul, MN 55117For SaleMLS ID #6766977, Shari L Gesche, Pemberton RE. NorthstarMLS as distributed by MLS GRID
