$267,000
3 bd|2 ba|1.2k sqft
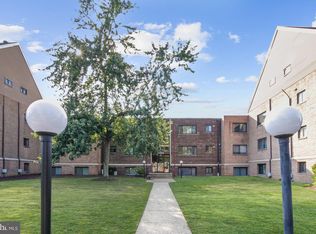
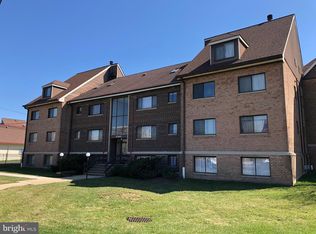
11601 Elkin St APT 4, Wheaton, MD 20902
Off Market
Zillow last checked:
Listing updated:
Cydni M Gilliam 410-824-5414,
R.E. Shilow Realty Investors, Inc. (443) 602-9096
$219,100
$208,000 - $230,000
$2,041/mo
| Date | Event | Price |
|---|---|---|
| 7/3/2026 | Listed for sale | $220,000-2%$234/sqft |
Source: | ||
| 2/4/2026 | Listing removed | $224,500$239/sqft |
Source: | ||
| 7/10/2025 | Price change | $224,500-2.2%$239/sqft |
Source: | ||
| 3/27/2025 | Listed for sale | $229,500+4.3%$244/sqft |
Source: | ||
| 6/9/2023 | Sold | $220,000$234/sqft |
Source: Public Record Report a problem | ||
| 9/23/2022 | Sold | $220,000+4.8%$234/sqft |
Source: | ||
| 8/15/2022 | Pending sale | $209,900$223/sqft |
Source: | ||
| 7/30/2022 | Listed for sale | $209,900+179.9%$223/sqft |
Source: | ||
| 1/27/2018 | Listing removed | $1,300$1/sqft |
Source: Nitro Realty #1001006837 Report a problem | ||
| 9/13/2017 | Listed for rent | $1,300$1/sqft |
Source: Nitro Realty #MC10055371 Report a problem | ||
| 6/13/2013 | Listing removed | $1,300$1/sqft |
Source: Jobin Realty #MC8056779 Report a problem | ||
| 4/18/2013 | Listed for rent | $1,300+4%$1/sqft |
Source: Jobin Realty #MC8056779 Report a problem | ||
| 4/8/2012 | Listing removed | $1,250$1/sqft |
Source: Jobin Realty #MC7808958 Report a problem | ||
| 4/3/2012 | Listed for rent | $1,250$1/sqft |
Source: Jobin Realty #MC7808958 Report a problem | ||
| 7/7/1994 | Sold | $75,000$80/sqft |
Source: Public Record Report a problem | ||
| Year | Property taxes | Tax assessment |
|---|---|---|
| 2025 | $1,697 -24.4% | $200,000 +2.6% |
| 2024 | $2,245 +4.4% | $195,000 +4.5% |
| 2023 | $2,151 +9.3% | $186,667 +4.7% |
| 2022 | $1,968 +5% | $178,333 +4.9% |
| 2021 | $1,874 +4% | $170,000 +4.1% |
| 2020 | $1,802 +8.9% | $163,333 +8.9% |
| 2019 | $1,654 -0.2% | $150,000 |
| 2018 | $1,657 +2.5% | $150,000 +8.4% |
| 2017 | $1,616 +78.7% | $138,333 +9.2% |
| 2016 | $904 | $126,667 +10.1% |
| 2015 | $904 | $115,000 |
| 2014 | $904 | $115,000 |
| 2013 | -- | $115,000 -20.7% |
| 2012 | -- | $145,000 |
| 2011 | -- | $145,000 |
| 2010 | -- | $145,000 -34.1% |
| 2009 | -- | $220,000 +17.9% |
| 2008 | -- | $186,666 +21.7% |
| 2007 | -- | $153,333 +27.8% |
| 2006 | -- | $120,000 +14.8% |
| 2005 | -- | $104,500 +17.4% |
| 2004 | -- | $89,000 +21.1% |
| 2003 | -- | $73,500 +0.7% |
| 2002 | -- | $73,000 |
| 2001 | -- | $73,000 |
Find assessor info on the county website
Source: Bright MLS. This data may not be complete. We recommend contacting the local school district to confirm school assignments for this home.
A local agent can set up tours, give advice and negotiate with sellers.