$160,700
3 bd|1 ba|1.1k sqft
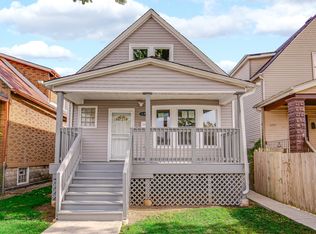
12428 S State St, Chicago, IL 60628
Off Market
Zillow last checked:
Maribel Castillo Sanchez (312)375-1810,
RE/MAX Mi Casa
Not available
Estimated sales range
Not available
Not available
| Date | Event | Price |
|---|---|---|
| 6/4/2026 | Listing removed | $268,500$164/sqft |
Source: MRED as distributed by MLS GRID #12648759 Report a problem | ||
| 5/14/2026 | Listed for sale | $268,500-0.2%$164/sqft |
Source: | ||
| 5/14/2026 | Listing removed | $269,000$165/sqft |
Source: | ||
| 4/7/2026 | Listed for sale | $269,000$165/sqft |
Source: | ||
| 3/21/2026 | Contingent | $269,000$165/sqft |
Source: | ||
| 2/17/2026 | Listed for sale | $269,000-3.6%$165/sqft |
Source: | ||
| 2/12/2026 | Listing removed | $279,000$171/sqft |
Source: | ||
| 12/18/2025 | Listed for sale | $279,000-1.2%$171/sqft |
Source: | ||
| 12/17/2025 | Listing removed | $282,500$173/sqft |
Source: | ||
| 12/2/2025 | Listed for sale | $282,500-0.9%$173/sqft |
Source: | ||
| 12/2/2025 | Listing removed | $285,000$174/sqft |
Source: | ||
| 10/23/2025 | Listed for sale | $285,000$174/sqft |
Source: | ||
| 10/14/2025 | Listing removed | $285,000$174/sqft |
Source: | ||
| 10/10/2025 | Listed for sale | $285,000$174/sqft |
Source: | ||
| 8/28/2025 | Listing removed | $285,000$174/sqft |
Source: | ||
| 8/25/2025 | Listed for sale | $285,000+256.3%$174/sqft |
Source: | ||
| 7/10/2025 | Sold | $80,000$49/sqft |
Source: | ||
| 5/28/2025 | Pending sale | $80,000$49/sqft |
Source: | ||
| 5/12/2025 | Contingent | $80,000$49/sqft |
Source: | ||
| 5/3/2025 | Listed for sale | $80,000$49/sqft |
Source: | ||
| Year | Property taxes | Tax assessment |
|---|---|---|
| 2024 | -- | $30,936 +121% |
| 2023 | $2,961 +2.5% | $13,999 0% |
| 2022 | $2,888 +2.3% | $14,000 |
| 2021 | $2,823 -2.4% | $14,000 +8.1% |
| 2020 | $2,892 +133.2% | $12,952 -9% |
| 2019 | $1,240 +1.5% | $14,234 |
| 2018 | $1,221 -6.6% | $14,234 +4.4% |
| 2017 | $1,307 -23.8% | $13,633 |
| 2016 | $1,716 +4% | $13,633 |
| 2015 | $1,649 -32.8% | $13,633 +3.3% |
| 2014 | $2,454 +2% | $13,193 |
| 2013 | $2,405 +50% | $13,193 |
| 2012 | $1,603 -4% | $13,193 +7.3% |
| 2011 | $1,669 -2.3% | $12,299 |
| 2010 | $1,709 +6.6% | $12,299 |
| 2009 | $1,603 +2.8% | $12,299 -22.3% |
| 2008 | $1,559 +3.3% | $15,829 |
| 2007 | $1,510 +0.8% | $15,829 |
| 2006 | $1,498 -5.2% | $15,829 +35.7% |
| 2005 | $1,580 +1.9% | $11,662 |
| 2004 | $1,551 -16.1% | $11,662 |
| 2003 | $1,849 -2.5% | $11,662 +10.6% |
| 2002 | $1,897 +3.7% | $10,544 |
| 2001 | $1,829 +5.4% | $10,544 |
| 2000 | $1,735 -0.7% | $10,544 +16.9% |
| 1999 | $1,747 | $9,019 |
Find assessor info on the county website
Source: MRED as distributed by MLS GRID. This data may not be complete. We recommend contacting the local school district to confirm school assignments for this home.
A local agent can set up tours, give advice and negotiate with sellers.