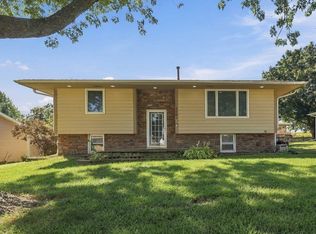
$225,400
4 bd1 ba1k sqft
1309 Meadow Dr, Norwalk, IA 50211
Off Market
Likely to sell faster than
Zillow last checked:
Listing updated:
Brandon Johnson (515)255-2020,
RE/MAX Cornerstone
 Originating MLS: Des Moines Area Association of REALTORS
Not available
Estimated sales range
Not available
Not available
| Date | Event | Price |
|---|---|---|
| 10/27/2026 | Listed for sale | $275,000+4.6%$152/sqft |
Source:  DMMLS #752013 Report a problem | ||
| 7/10/2026 | Sold | $263,000-2.6%$145/sqft |
Source: DMMLS #739934 Report a problem | ||
| 6/10/2026 | Pending sale | $270,000$149/sqft |
Source: DMMLS #739934 Report a problem | ||
| 5/4/2026 | Listed for sale | $270,000-25.1%$149/sqft |
Source: DMMLS #739934 Report a problem | ||
| 8/1/2023 | Listing removed | -- |
Source:  DR Horton Report a problem | ||
| 4/10/2023 | Pending sale | $360,390+1.5%$199/sqft |
Source: DR Horton Report a problem | ||
| 4/8/2023 | Price change | $354,990+39.2%$196/sqft |
Source: DR Horton Report a problem | ||
| 12/14/2022 | Pending sale | $255,000$141/sqft |
Source: DMMLS #664948 Report a problem | ||
| 12/14/2022 | Listed for sale | $255,000$141/sqft |
Source: DMMLS #664948 Report a problem | ||
| 10/12/2022 | Sold | $255,000$141/sqft |
Source: DMMLS #664948 Report a problem | ||
| 8/27/2022 | Pending sale | $255,000$141/sqft |
Source: Owner Report a problem | ||
| 8/22/2022 | Listed for sale | $255,000+168.4%$141/sqft |
Source: Owner Report a problem | ||
| 3/23/2015 | Sold | $95,000+31.9%$52/sqft |
Source: DMMLS #440664 Report a problem | ||
| 7/22/2014 | Sold | $72,016-47.4%$40/sqft |
Source: Public Record Report a problem | ||
| 2/14/2014 | Listing removed | $137,000$76/sqft |
Source: RE/MAX AMERICAN DREAM REALTY #419740 Report a problem | ||
| 7/31/2013 | Price change | $137,000-6.8%$76/sqft |
Source: RE/MAX AMERICAN DREAM REALTY #419740 Report a problem | ||
| 6/19/2013 | Listed for sale | $147,000-21.9%$81/sqft |
Source: RE/MAX AMERICAN DREAM REALTY #419740 Report a problem | ||
| 5/2/2007 | Sold | $188,250$104/sqft |
Source: Public Record Report a problem | ||
| Year | Property taxes | Tax assessment |
|---|---|---|
| 2025 | $4,602 +0.1% | $263,500 +7.9% |
| 2024 | $4,596 +22.2% | $244,200 |
| 2023 | $3,760 +0.4% | $244,200 +38% |
| 2022 | $3,746 -0.6% | $177,000 |
| 2021 | $3,768 -3.6% | $177,000 +5.4% |
| 2020 | $3,910 +11.6% | $167,900 |
| 2019 | $3,502 +3% | $167,900 +15.6% |
| 2018 | $3,400 +6.6% | $145,200 |
| 2017 | $3,190 -5.5% | -- |
| 2016 | $3,374 | $140,400 |
| 2015 | $3,374 | -- |
| 2014 | $3,374 +25.1% | $130,800 |
| 2013 | $2,698 +0.8% | -- |
| 2012 | $2,676 +6.9% | -- |
| 2011 | $2,504 +7.2% | -- |
| 2010 | $2,336 -2.7% | -- |
| 2009 | $2,400 +2.6% | -- |
| 2008 | $2,340 +4.2% | -- |
| 2007 | $2,246 | -- |
Source: DMMLS. This data may not be complete. We recommend contacting the local school district to confirm school assignments for this home.


A local agent can set up tours, give advice and negotiate with sellers.