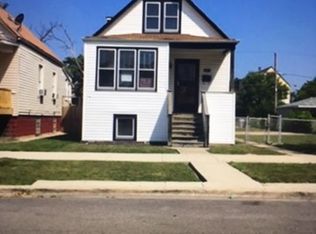
$68,100
2 bd|1 ba|633 sqft
1410 W 73rd Pl, Chicago, IL 60636
Off Market
Zillow last checked:
Listing updated:
Caden Wakim 331-588-6574,
GenStone Realty,
Alfred Rotiroti 630-853-1228,
GenStone Realty
$173,400
$165,000 - $182,000
$1,797/mo
| Date | Event | Price |
|---|---|---|
| 1/1/2023 | Listing removed | -- |
Source: | ||
| 8/20/2022 | Listed for sale | $246,000+2136.4%$194/sqft |
Source: | ||
| 8/30/2018 | Sold | $11,000+12.2%$9/sqft |
Source: | ||
| 8/10/2018 | Pending sale | $9,800$8/sqft |
Source: Carrington Real Estate Services(US) LLC #10005716 Report a problem | ||
| 7/3/2018 | Listed for sale | $9,800-59.2%$8/sqft |
Source: Carrington Real Estate Services(US) LLC #10005716 Report a problem | ||
| 4/7/2017 | Listing removed | $24,000$19/sqft |
Source: Enterprise Realty Power Broker #09188446 Report a problem | ||
| 8/2/2016 | Price change | $24,000-7.7%$19/sqft |
Source: Enterprise Realty Power Broker #09188446 Report a problem | ||
| 6/6/2016 | Price change | $26,000-7.1%$21/sqft |
Source: Enterprise Realty Power Broker #09188446 Report a problem | ||
| 4/15/2016 | Price change | $28,000-6.7%$22/sqft |
Source: Enterprise Realty Power Broker #09188446 Report a problem | ||
| 4/8/2016 | Listed for sale | $30,000-58.3%$24/sqft |
Source: Enterprise Realty Power Broker #09188446 Report a problem | ||
| 2/27/2002 | Sold | $72,000$57/sqft |
Source: Public Record Report a problem | ||
| Year | Property taxes | Tax assessment |
|---|---|---|
| 2024 | -- | $4,101 +105% |
| 2023 | $422 +2.6% | $2,000 |
| 2022 | $411 +2.3% | $2,000 |
| 2021 | $402 -63.8% | $2,000 -59.9% |
| 2020 | $1,112 -0.2% | $4,992 -10% |
| 2019 | $1,114 +167.2% | $5,547 |
| 2018 | $417 -46.1% | $5,547 -20.4% |
| 2017 | $774 -13.6% | $6,969 |
| 2016 | $896 +12.5% | $6,969 |
| 2015 | $796 +11.7% | $6,969 +8.7% |
| 2014 | $713 +3.7% | $6,412 |
| 2013 | $688 +79.6% | $6,412 |
| 2012 | $383 -58.3% | $6,412 -33.9% |
| 2011 | $918 +16.2% | $9,704 |
| 2010 | $790 +34.4% | $9,704 |
| 2009 | $588 +7.7% | $9,704 -4.4% |
| 2008 | $546 +3.2% | $10,152 |
| 2007 | $529 +0.8% | $10,152 |
| 2006 | $525 -5.1% | $10,152 +45.4% |
| 2005 | $553 -51% | $6,981 |
| 2004 | $1,129 +2.2% | $6,981 |
| 2003 | $1,105 +26% | $6,981 +43% |
| 2002 | $877 +77.2% | $4,881 |
| 2001 | $495 -27.7% | $4,881 |
| 2000 | $684 +136.3% | $4,881 +37.1% |
| 1999 | $290 | $3,561 |
Find assessor info on the county website
Source: MRED as distributed by MLS GRID. This data may not be complete. We recommend contacting the local school district to confirm school assignments for this home.
A local agent can set up tours, give advice and negotiate with sellers.