Executive Ranch in the North End with 1624 square ft. The lot is .26 acre, stone wall that wraps around the whole property. Two bedrooms with possible third bedroom, one full bath, washer and dryer on main floor, fireplace in living room, 2 stall garage, gas heat baseboard and AC central air, 200 amp service ,Vinyl siding.
For sale
Price increase: $900 (9/29)
$499,900
156 Eastview Ave, Somerset, MA 02726
2beds
1,624sqft
Single Family Residence
Built in 1964
0.26 Acres Lot
$494,900 Zestimate®
$308/sqft
$-- HOA
What's special
Ac central airGas heat baseboardVinyl sidingTwo bedrooms
- 22 days
- 772
- 25
Zillow last checked:
Listing updated:
Listed by:
Derek Eisenberg 877-996-5728,
Continental Real Estate Group, Inc. 877-996-5728,
Derek Eisenberg 877-996-5728
Source: MLS PIN,MLS#: 73583783
Facts & features
Interior
Bedrooms & bathrooms
- Bedrooms: 2
- Bathrooms: 1
- Full bathrooms: 1
Heating
- Baseboard, Natural Gas
Cooling
- Central Air
Appliances
- Included: Washer, Dryer
Features
- Basement: Full
- Number of fireplaces: 1
Interior area
- Total structure area: 1,624
- Total interior livable area: 1,624 sqft
- Finished area above ground: 1,624
Property
Parking
- Total spaces: 6
- Parking features: Attached
- Attached garage spaces: 2
- Uncovered spaces: 4
Features
- Exterior features: Stone Wall
Lot
- Size: 0.26 Acres
- Features: Corner Lot
Details
- Parcel number: M:0D8 L:0087,4020063
- Zoning: R1
Construction
Type & style
- Home type: SingleFamily
- Architectural style: Ranch
- Property subtype: Single Family Residence
Materials
- Foundation: Other
Condition
- Year built: 1964
Utilities & green energy
- Electric: 200+ Amp Service
- Sewer: Other
- Water: Public
Community & HOA
HOA
- Has HOA: No
Location
- Region: Somerset
Financial & listing details
- Price per square foot: $308/sqft
- Tax assessed value: $433,400
- Annual tax amount: $5,764
- Date on market: 9/29/2026
Estimated market value
$494,900
$470,000 - $520,000
$2,473/mo
Price history
| Date | Event | Price |
|---|---|---|
| 9/29/2026 | Price change | $499,900+0.2%$308/sqft |
Source: MLS PIN #73583783 Report a problem | ||
| 9/11/2026 | Listed for sale | $499,000$307/sqft |
Source: Owner Report a problem | ||
| 9/11/2026 | Pending sale | $499,000-3.1%$307/sqft |
Source: Owner Report a problem | ||
| 7/16/2026 | Listed for sale | $515,000+94.3%$317/sqft |
Source: Owner Report a problem | ||
| 5/26/2004 | Sold | $265,000$163/sqft |
Source: Public Record Report a problem | ||
Public tax history
| Year | Property taxes | Tax assessment |
|---|---|---|
| 2025 | $5,764 +6.4% | $433,400 +2.3% |
| 2024 | $5,419 +13.1% | $423,700 +12.1% |
| 2023 | $4,791 +8.1% | $377,800 +13.3% |
| 2022 | $4,431 -0.9% | $333,400 +9.4% |
| 2021 | $4,473 -1.2% | $304,700 +2.4% |
| 2020 | $4,529 -11.5% | $297,600 +6.1% |
| 2019 | $5,117 +16.5% | $280,400 +8.2% |
| 2018 | $4,394 +2.4% | $259,100 +5% |
| 2017 | $4,293 -0.6% | $246,700 |
| 2016 | $4,320 +7% | $246,700 +6.1% |
| 2015 | $4,036 -29% | $232,600 -1.2% |
| 2014 | $5,687 +59.6% | $235,500 -0.6% |
| 2013 | $3,563 +15.8% | $236,900 -2.3% |
| 2012 | $3,077 +3.7% | $242,500 -2.4% |
| 2011 | $2,967 +0.1% | $248,500 -6.2% |
| 2010 | $2,963 -0.7% | $265,000 -6.9% |
| 2009 | $2,985 -1.9% | $284,600 -4.6% |
| 2008 | $3,044 -3.6% | $298,400 -5.5% |
| 2007 | $3,158 +2.3% | $315,800 +5.1% |
| 2006 | $3,088 +11% | $300,400 +15.9% |
| 2005 | $2,782 +20.9% | $259,300 +21.9% |
| 2004 | $2,301 +13.2% | $212,700 +20.3% |
| 2003 | $2,033 +13% | $176,800 +17.9% |
| 2001 | $1,799 | $149,900 |
Find assessor info on the county website
Monthly payment
Est. payment
Payment breakdown
Explore the cost of this home by adjusting the details. Changes won't be saved.Climate risks
Neighborhood: 02726
Similar homes
- $--2 bd3 ba1.2k sqft220 Pleasant St, Somerset, MA 02726Auction
 Auction.com 2
- $470,0003 bd1 ba1.2k sqft51 Robin Ln, Somerset, MA 02726For Sale
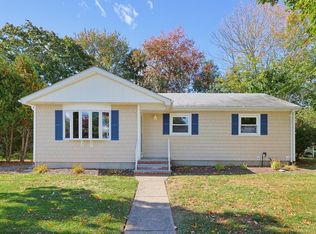 MLS ID #73590939, Lindsay Amaral, The Mello Group, Inc.. MLS PIN
- $549,0004 bd3 ba2.3k sqft3320 County St, Somerset, MA 02726For Sale
 MLS ID #73578379, Philip Rebello, Keller Williams South Watuppa. MLS PIN
- $529,9004 bd2 ba2k sqft101 Hillside Ave, Somerset, MA 02726For Sale
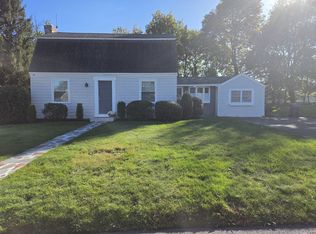 MLS ID #73591481, Danielle Soares, Affordable Real Estate, Inc.. MLS PIN
- $599,9004 bd2 ba1.9k sqft442 Eastview Ave, Somerset, MA 02726For Sale
 MLS ID #1424093, Tonya Peluso, Peluso Properties. StateWide MLS RI
