This 1670 square foot single family home has 3 bedrooms and 2.0 bathrooms. This home is located at 1737 Fox Run Rd, Reno, NV 89523.
Pre-foreclosure
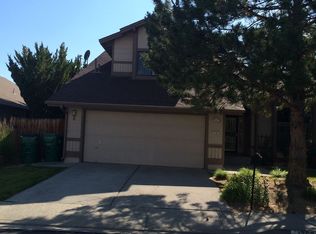
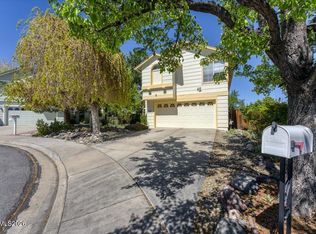
Street View
Est. $608,900
1737 Fox Run Rd, Reno, NV 89523
3beds
2baths
1,670sqft
SingleFamily
Built in 1989
6,011 Square Feet Lot
$608,900 Zestimate®
$365/sqft
$-- HOA
Overview
- 110 days |
- 19 |
- 0 |
Facts & features
Interior
Bedrooms & bathrooms
- Bedrooms: 3
- Bathrooms: 2
Heating
- Forced air
Cooling
- Central
Features
- Has fireplace: Yes
Interior area
- Total interior livable area: 1,670 sqft
Property
Parking
- Parking features: Garage - Attached
Features
- Exterior features: Stucco
Lot
- Size: 6,011 Square Feet
Details
- Parcel number: 03950305
Construction
Type & style
- Home type: SingleFamily
Materials
- Frame
- Roof: Composition
Condition
- Year built: 1989
Community & HOA
Location
- Region: Reno
Financial & listing details
- Price per square foot: $365/sqft
- Tax assessed value: $266,158
- Annual tax amount: $2,935
Visit our professional directory to find a foreclosure specialist in your area that can help with your home search.
Find a foreclosure agentForeclosure details
Estimated market value
$608,900
$578,000 - $639,000
$2,640/mo
Price history
| Date | Event | Price |
|---|---|---|
| 6/23/2022 | Sold | $550,000-4.3%$329/sqft |
Source: Public Record Report a problem | ||
| 5/17/2022 | Pending sale | $575,000$344/sqft |
Source: | ||
| 5/11/2022 | Listed for sale | $575,000+263.9%$344/sqft |
Source: | ||
| 12/13/1996 | Sold | $158,000$95/sqft |
Source: Public Record Report a problem | ||
Public tax history
| Year | Property taxes | Tax assessment |
|---|---|---|
| 2026 | $2,935 +7.9% | $93,156 +0.8% |
| 2025 | $2,719 +8% | $92,448 +2.2% |
| 2024 | $2,518 +8.1% | $90,442 -0.1% |
| 2023 | $2,329 +0.9% | $90,552 +20.1% |
| 2022 | $2,309 +8.4% | $75,417 +16.6% |
| 2021 | $2,130 +3% | $64,675 +3% |
| 2020 | $2,067 -2.9% | $62,761 |
| 2019 | $2,130 +3% | $62,761 +11.8% |
| 2018 | $2,067 +8.8% | $56,118 +1.4% |
| 2017 | $1,900 | $55,322 -1.2% |
| 2016 | $1,900 | $55,972 +2.9% |
| 2015 | $1,900 +296.6% | $54,374 +6.6% |
| 2014 | $479 -74% | $51,026 +4.8% |
| 2013 | $1,842 | $48,680 |
| 2012 | -- | $48,680 +0.1% |
| 2011 | -- | $48,652 -3.3% |
| 2010 | -- | $50,337 -15% |
| 2009 | -- | $59,240 -5.3% |
| 2008 | -- | $62,547 -13.2% |
| 2007 | -- | $72,022 +26% |
| 2006 | -- | $57,158 +8.5% |
| 2005 | -- | $52,672 -0.7% |
| 2004 | -- | $53,033 +3.5% |
| 2003 | -- | $51,256 +0.7% |
| 2002 | -- | $50,918 |
| 2001 | -- | $50,918 |
Find assessor info on the county website
Monthly payment
Estimated monthly payment$1,822
All calculations are estimates and provided by Zillow, Inc. for informational purposes only. Actual amounts may vary.
HOA fees may include property taxes on listings classified as Co-Ops. Contact the listing agent and/or owner for fee details.
Mortgage interest rates are dependent on a number of factors, including credit score, down payment, and repayment length. Interest rate data provided by Zillow Group Marketplace, Inc. as of 1/1/1970 from various mortgage lenders with which we have lead or other similar arrangements; the Estimated Payment is an average of those rates.
See how much you could borrow to make a competitive offer.
Climate risks
Neighborhood: Mae Anne
Nearby schools
GreatSchools rating
- 6/10Sarah Winnemucca Elementary SchoolGrades: PK-5Distance: 0.5 mi
- 5/10B D Billinghurst Middle SchoolGrades: 6-8Distance: 1.2 mi
- 7/10Robert Mc Queen High SchoolGrades: 9-12Distance: 0.7 mi


- Nevada
- Washoe County
- Reno
- 89523
- Mae Anne
- 1737 Fox Run Rd
Nearby cities
Nearby neighborhoods
Nearby zip codes
Other Reno Topics
