This property has been recently redone. Complexly redone and has some amazing finishes. You wont want to miss out on this property. Great income property as well.
For sale
$369,999
1813 N 38th Ln, Phoenix, AZ 85009
3beds
1,300sqft
Single Family Residence
Built in 1946
6,098 Square Feet Lot
$367,100 Zestimate®
$285/sqft
$-- HOA
What's special
Amazing finishes
- 5 hours
- 26
- 2
Zillow last checked:
Listing updated:
Listed by:
John Wilfert 432-352-5511,
Unity Realty
Source: MLS of Southern Arizona,MLS#: 22625727
Facts & features
Interior
Bedrooms & bathrooms
- Bedrooms: 3
- Bathrooms: 1
- Full bathrooms: 1
Heating
- Forced Air
Cooling
- Central Air
Appliances
- Included: Dishwasher
- Laundry: Washer, Dryer
Features
- Flooring: Laminate
- Has fireplace: No
- Fireplace features: None
Interior area
- Total structure area: 1,300
- Total interior livable area: 1,300 sqft
Property
Parking
- Parking features: None
Accessibility
- Accessibility features: None
Features
- Levels: One
- Stories: 1
- Patio & porch: Patio
- Exterior features: None
- Pool features: None
- Spa features: None
- Fencing: Wood
- View description: None
Lot
- Size: 6,098 Square Feet
- Dimensions: 50 X 118 X 50 118
- Features: East/West Exposure
Details
- Parcel number: 10823131
- Zoning: Other - CALL
- Special conditions: None
Construction
Type & style
- Home type: SingleFamily
- Architectural style: Modern
- Property subtype: Single Family Residence
Materials
- Roof: Shingle
Condition
- Year built: 1946
Utilities & green energy
- Electric: None
- Sewer: Sewer Connected
- Water: Public
Community & HOA
Community
- Features: None
- Security: None
HOA
- Has HOA: No
Location
- Region: Phoenix
Financial & listing details
- Price per square foot: $285/sqft
- Tax assessed value: $207,100
- Annual tax amount: $1,332
- Date on market: 10/21/2026
- Listing terms: FHA,Conventional,Cash
- Road surface type: Paved
Estimated market value
$367,100
$349,000 - $385,000
$1,710/mo
Price history
| Date | Event | Price |
|---|---|---|
| 10/21/2026 | Listed for sale | $369,999+76.2%$285/sqft |
Source:  MLS of Southern Arizona #22625727 Report a problem | ||
| 3/24/2026 | Sold | $210,000+736.7%$162/sqft |
Source: Public Record Report a problem | ||
| 3/24/2021 | Listing removed | -- |
Source: Owner Report a problem | ||
| 11/27/2019 | Listing removed | $1,000$1/sqft |
Source: Owner Report a problem | ||
| 11/18/2019 | Listed for rent | $1,000+17.6%$1/sqft |
Source: Owner Report a problem | ||
| 12/18/2017 | Listing removed | $850$1/sqft |
Source: Owner Report a problem | ||
| 12/16/2017 | Listed for rent | $850$1/sqft |
Source: Owner Report a problem | ||
| 7/13/2009 | Sold | $25,100+19.5%$19/sqft |
Source:  ARMLS #4160783 Report a problem | ||
| 6/27/2009 | Price change | $21,000-84.9%$16/sqft |
Source: foreclosure.com Report a problem | ||
| 5/15/2009 | Listed for sale | -- |
Source: foreclosure.com Report a problem | ||
| 3/27/2009 | Sold | $139,494+4.2%$107/sqft |
Source: Public Record Report a problem | ||
| 8/1/2005 | Sold | $133,900$103/sqft |
Source: ARMLS #2311061 Report a problem | ||
Public tax history
| Year | Property taxes | Tax assessment |
|---|---|---|
| 2025 | $1,332 -0.8% | $20,710 -5.5% |
| 2024 | $1,343 +2.5% | $21,910 +194.5% |
| 2023 | $1,310 +4.9% | $7,439 -49% |
| 2022 | $1,250 +2.2% | $14,600 +21.5% |
| 2021 | $1,223 +1.8% | $12,020 +29.1% |
| 2020 | $1,201 +195.5% | $9,310 +9.5% |
| 2019 | $407 | $8,500 +26.9% |
| 2018 | $407 +0.6% | $6,700 +32.1% |
| 2017 | $404 +41.3% | $5,070 +26.8% |
| 2016 | $286 +6.7% | $4,000 +22.7% |
| 2015 | $268 | $3,260 +57.5% |
| 2014 | -- | $2,070 +40.8% |
| 2013 | -- | $1,470 -14.5% |
| 2012 | -- | $1,720 -8% |
| 2011 | -- | $1,870 -56.3% |
| 2010 | -- | $4,280 -54.6% |
| 2009 | -- | $9,430 -13.5% |
| 2008 | -- | $10,900 +25.3% |
| 2007 | -- | $8,700 +47.5% |
| 2006 | -- | $5,900 |
| 2005 | -- | $5,900 +15.7% |
| 2004 | -- | $5,100 |
| 2003 | -- | $5,100 +54.5% |
| 2002 | -- | $3,300 |
Find assessor info on the county website
Monthly payment
Est. payment
Payment breakdown
Explore the cost of this home by adjusting the details. Changes won't be saved.Climate risks
Neighborhood: Maryvale

Similar homes
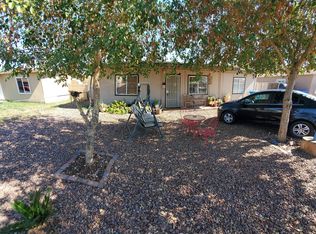
- $365,0004 bd2 ba1k sqft1648 N 38TH Drive, Phoenix, AZ 85009For Sale
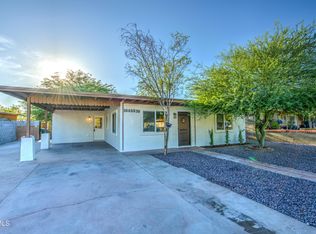 MLS ID #7080004, Abasin Akhundzada, eXp Realty. ARMLS
- $--3 bd2 ba1.1k sqft3010 W Almeria Rd, Phoenix, AZ 85009Auction
 Auction.com 2
- $--3 bd2 ba1.1k sqft4124 W Encanto Blvd, Phoenix, AZ 85009Auction
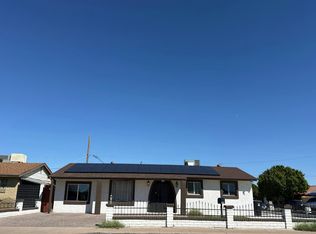 Auction.com 2
- $355,0003 bd2 ba1.3k sqft3820 W MONTE VISTA Road, Phoenix, AZ 85009For Sale
 MLS ID #7039740, Gloria A Castillo, West USA Realty. ARMLS
