BACK ON THE MARKET--BUYER FINANCING FELL THROUGH COME SEE IT BEFORE ITS GONE!!!! ****PRICE JUST REDUCED**** THIS GORGEOUS HOME IS TRULY MOVE IN READY!!! NEW FROM TOP TO BOTTOM... NEW ROOF, A/C, WATER HEATER, FLOORING, PAINT (INTERIOR & EXTERIOR) NEW KITCHEN CABINETS & APPLIANCES, BUTCHER BLOCK COUNTER TOPS.
Pre-foreclosure
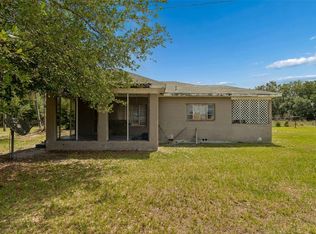
Street View
Est. $326,900
2205 Colson Rd, Plant City, FL 33567
4beds
1,825sqft
SingleFamily
Built in 1963
0.95 Acres Lot
$326,900 Zestimate®
$179/sqft
$-- HOA
Overview
- 303 days |
- 24 |
- 0 |
Facts & features
Interior
Bedrooms & bathrooms
- Bedrooms: 4
- Bathrooms: 1
- Full bathrooms: 1
Heating
- Other
Cooling
- Central
Features
- Cathedral Ceiling(s), Kitchen/Family Room Combo
- Flooring: Laminate
Interior area
- Total interior livable area: 1,825 sqft
Property
Features
- Exterior features: Other, Stucco
Lot
- Size: 0.95 Acres
Details
- Parcel number: 222923ZZZ000005057100U
- Zoning: ASC-1
Construction
Type & style
- Home type: SingleFamily
Materials
- masonry
- Roof: Composition
Condition
- Year built: 1963
Utilities & green energy
- Sewer: Private Sewer
- Water: Well
- Utilities for property: Cable Available
Community & HOA
Community
- Subdivision: COLSON ACRES
Location
- Region: Plant City
Financial & listing details
- Price per square foot: $179/sqft
- Tax assessed value: $238,487
- Annual tax amount: $4,950
Visit our professional directory to find a foreclosure specialist in your area that can help with your home search.
Find a foreclosure agentForeclosure details
Estimated market value
$326,900
$297,000 - $353,000
$2,247/mo
Price history
| Date | Event | Price |
|---|---|---|
| 4/5/2019 | Sold | $204,900-2.4%$112/sqft |
Source: Public Record Report a problem | ||
| 2/20/2019 | Price change | $209,900-4.5%$115/sqft |
Source: SIGNATURE REALTY ASSOCIATES #T3148218 Report a problem | ||
| 1/26/2019 | Price change | $219,900-2.3%$120/sqft |
Source: SIGNATURE REALTY ASSOCIATES #T3148218 Report a problem | ||
| 1/22/2019 | Price change | $225,000-1.3%$123/sqft |
Source: SIGNATURE REALTY ASSOCIATES #T3148218 Report a problem | ||
| 1/16/2019 | Price change | $227,900+1.3%$125/sqft |
Source: SIGNATURE REALTY ASSOCIATES #T3148218 Report a problem | ||
| 1/12/2019 | Listed for sale | $225,000$123/sqft |
Source: SIGNATURE REALTY ASSOCIATES #T3148218 Report a problem | ||
| 1/12/2019 | Pending sale | $225,000$123/sqft |
Source: SIGNATURE REALTY ASSOCIATES #T3148218 Report a problem | ||
| 12/23/2018 | Listed for sale | $225,000+171.1%$123/sqft |
Source: SIGNATURE REALTY ASSOCIATES #T3148218 Report a problem | ||
| 7/7/2018 | Sold | $83,000-1.2%$45/sqft |
Source: Public Record Report a problem | ||
| 5/5/2018 | Price change | $84,000-5.6%$46/sqft |
Source: BK159561 #T2931802 Report a problem | ||
| 3/24/2018 | Price change | $89,000-10.1%$49/sqft |
Source: BK159561 #T2931802 Report a problem | ||
| 3/1/2018 | Price change | $99,000-9.2%$54/sqft |
Source: BOB BAGGETT REALTY #T2931802 Report a problem | ||
| 2/4/2018 | Price change | $109,000-4.4%$60/sqft |
Source: REALHome Services and Solutions #O5550428 Report a problem | ||
| 1/7/2018 | Price change | $114,000-11.6%$62/sqft |
Source: REALHome Services and Solutions #O5550428 Report a problem | ||
| 12/5/2017 | Listed for sale | $129,000-23.2%$71/sqft |
Source: OWNERS.COM #O5550428 Report a problem | ||
| 8/10/2006 | Sold | $168,000$92/sqft |
Source: Public Record Report a problem | ||
Public tax history
| Year | Property taxes | Tax assessment |
|---|---|---|
| 2025 | $4,950 +10.5% | $238,487 +7.4% |
| 2024 | $4,480 +8% | $221,955 +10% |
| 2023 | $4,149 +6.4% | $201,777 +10% |
| 2022 | $3,901 +13.6% | $183,434 +10% |
| 2021 | $3,434 +10.8% | $166,758 +10% |
| 2020 | $3,101 +8.4% | $151,598 +9.9% |
| 2019 | $2,860 | $137,956 +40.5% |
| 2018 | $2,860 +36.8% | $98,206 +35.7% |
| 2017 | $2,091 +29% | $72,345 -7% |
| 2016 | $1,621 -6.7% | $77,790 +9.2% |
| 2015 | $1,738 +5.8% | $71,210 -0.9% |
| 2014 | $1,643 | $71,881 +1% |
| 2013 | $1,643 +5.2% | $71,138 +9% |
| 2012 | $1,563 -12.9% | $65,278 -14.8% |
| 2011 | $1,794 -6.2% | $76,588 -7.8% |
| 2010 | $1,912 -18.4% | $83,028 -20.5% |
| 2009 | $2,345 -12.9% | $104,382 -14.2% |
| 2008 | $2,693 -6.8% | $121,718 -9% |
| 2007 | $2,888 +75.7% | $133,771 +44.8% |
| 2006 | $1,644 +0.7% | $92,379 +3% |
| 2005 | $1,633 | $89,688 +38.5% |
| 2004 | -- | $64,758 -2.1% |
| 2003 | -- | $66,164 +51.4% |
| 2002 | -- | $43,695 +1.6% |
| 2001 | -- | $43,007 -0.9% |
| 2000 | $555 | $43,417 |
Find assessor info on the county website
Monthly payment
Estimated monthly payment$1,822
All calculations are estimates and provided by Zillow, Inc. for informational purposes only. Actual amounts may vary.
HOA fees may include property taxes on listings classified as Co-Ops. Contact the listing agent and/or owner for fee details.
Mortgage interest rates are dependent on a number of factors, including credit score, down payment, and repayment length. Interest rate data provided by Zillow Group Marketplace, Inc. as of 1/1/1970 from various mortgage lenders with which we have lead or other similar arrangements; the Estimated Payment is an average of those rates.
See how much you could borrow to make a competitive offer.
Climate risks
Neighborhood: 33567
Nearby schools
GreatSchools rating
- 7/10Trapnell Elementary SchoolGrades: PK-5Distance: 3.7 mi
- 2/10Turkey Creek Middle SchoolGrades: 6-8Distance: 5.5 mi
- 4/10Durant High SchoolGrades: 9-12Distance: 6.8 mi


- Florida
- Hillsborough County
- Plant City
- 33567
- 2205 Colson Rd
Nearby cities
Nearby zip codes
Other Plant City Topics
