Multifamily investment opportunity featuring four units, with three units currently rented and recently renovated. The fourth unit is currently undergoing renovations, offering additional potential for increased rental income or owner occupied purchase. Well-maintained property with recent improvements and established cash flow. Ideal opportunity for investors seeking an income-producing property with additional upside. Seller financing is negotiable with 300K down. Feel free to drive by, walk by. Showings upon mutual acceptance per seller request.
Active
Listed by: Pellego, Inc. • Joanne Rocheford • 206-387-0293
$999,950
2301 O Street NE, Auburn, WA 98002
8beds
4baths
3,528sqft
Quadruplex, Multi Family
Built in 1977
-- sqft lot
$962,600 Zestimate®
$283/sqft
$-- HOA
What's special
- --
- on Zillow
- 53
- views
- 4
- saves
Likely to sell faster than
Zillow last checked:
Listing updated:
Listed by:
Joanne Rocheford 206-387-0293 rocheford@msn.com,
Pellego, Inc.
Source: NWMLS as distributed by MLS GRID,MLS#: 2600114
Facts & features
Interior
Bedrooms & bathrooms
- Bedrooms: 8
- Bathrooms: 4
Heating
- Baseboard, Electric
Cooling
- None
Features
- Has fireplace: No
Interior area
- Total structure area: 3,528
- Total interior livable area: 3,528 sqft
Property
Parking
- Total spaces: 14
- Parking features: Garage
- Garage spaces: 4
- Uncovered spaces: 10
Lot
- Size: 0.29 Acres
Details
- Parcel number: 2891740240
- Zoning description: Multi-Family,Jurisdiction: City
- Special conditions: Standard
Construction
Type & style
- Home type: MultiFamily
- Architectural style: 4-Plex
- Property subtype: Quadruplex, Multi Family
Materials
- Wood Siding
- Roof: Composition
Condition
- Average
- Year built: 1977
- Major remodel year: 1977
Utilities & green energy
- Electric: Company: PSE
- Sewer: Sewer Connected, Company: city of auburn
- Water: Company: city of auburn
Community & HOA
Community
- Subdivision: Auburn
Location
- Region: Auburn
Financial & listing details
- Price per square foot: $283/sqft
- Tax assessed value: $835,000
- Annual tax amount: $10,585
- Date on market: 11/19/2026
- Listing terms: FHA
Estimated market value
$962,600
$914,000 - $1.01M
$2,198/mo
Price history
| Date | Event | Price |
|---|---|---|
| 11/19/2026 | Listed for sale | $999,950+24.6%$283/sqft |
Source:  NWMLS as distributed by MLS GRID #2600114 Report a problem | ||
| 1/5/2022 | Sold | $802,760+138.6%$228/sqft |
Source: Public Record Report a problem | ||
| 8/10/2012 | Sold | $336,500+3.5%$95/sqft |
Source: NWMLS as distributed by MLS GRID #317034 Report a problem | ||
| 6/26/2012 | Pending sale | $325,000$92/sqft |
Source: John L Scott Real Estate #317034 Report a problem | ||
| 5/22/2012 | Listed for sale | $325,000$92/sqft |
Source: John L Scott Real Estate #317034 Report a problem | ||
| 4/30/2012 | Pending sale | $325,000$92/sqft |
Source: John L Scott Real Estate #317034 Report a problem | ||
| 2/23/2012 | Price change | $325,000-7%$92/sqft |
Source: John L Scott Real Estate #317034 Report a problem | ||
| 2/5/2012 | Listed for sale | $349,500$99/sqft |
Source: John L Scott Real Estate #317034 Report a problem | ||
Public tax history
| Year | Property taxes | Tax assessment |
|---|---|---|
| 2025 | $10,586 +5.7% | $835,000 -1.4% |
| 2024 | $10,013 -10.1% | $847,000 -6.7% |
| 2023 | $11,132 +18.1% | $908,000 +10.6% |
| 2022 | $9,423 +2.5% | $821,000 +18.8% |
| 2021 | $9,197 +1.7% | $691,000 +7.5% |
| 2020 | $9,041 +7.7% | $643,000 +7.7% |
| 2019 | $8,398 +23.1% | $597,000 +9.3% |
| 2018 | $6,820 -4% | $546,000 +21.1% |
| 2017 | $7,100 +37.6% | $451,000 +8.7% |
| 2016 | $5,161 | $415,000 +8.4% |
| 2015 | $5,161 | $383,000 +14.3% |
| 2014 | $5,161 | $335,000 +2.1% |
| 2013 | $5,161 | $328,000 -3.5% |
| 2012 | -- | $340,000 +9.7% |
| 2011 | -- | $310,000 -20.9% |
| 2010 | -- | $392,000 |
| 2009 | -- | $392,000 +18.8% |
| 2007 | -- | $330,000 +17.9% |
| 2006 | -- | $280,000 |
| 2005 | -- | $280,000 +30.2% |
| 2001 | $3,045 -4.8% | $215,000 |
| 2000 | $3,197 | $215,000 |
Find assessor info on the county website
Monthly payment
Est. payment
Payment breakdown
Explore the cost of this home by adjusting the details. Changes won't be saved.Climate risks
Neighborhood: 98002


Similar homes
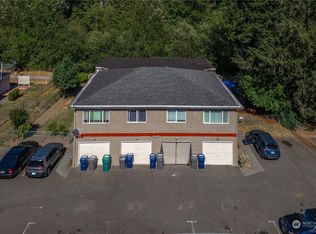
- $949,9988 bd4 ba3.5k sqft2826 D Place SE, Auburn, WA 98002Active
 MLS ID #2574331, Marius ion. NWMLS as distributed by MLS GRID
- $899,9505 bd3 ba2.8k sqftHillman's Auburndale Add, Auburn, WA 98092Active
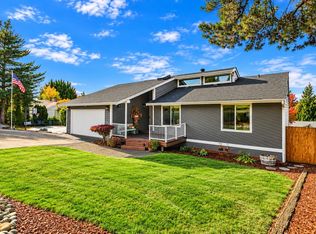 MLS ID #2599721, Kris Holden. NWMLS as distributed by MLS GRID
- $1,175,0006 bd4 ba3.2k sqft29832 Kent Black Diamond Road SE, Kent, WA 98042Active
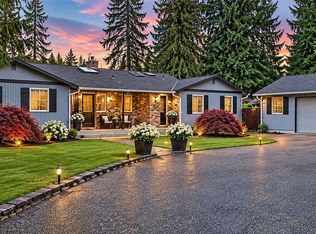 MLS ID #2603591, Jeannie Hood. NWMLS as distributed by MLS GRID
- $1,025,0008 bd4 ba3.7k sqft21614 29th Avenue S, Des Moines, WA 98198Active
 MLS ID #2577632, Adisu Fanta. NWMLS as distributed by MLS GRID
