$72,000
-- bd|-- ba|-- sqft
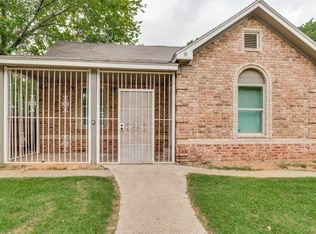
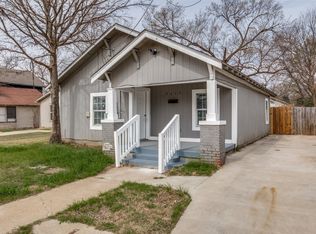
2319 Stoneman St, Dallas, TX 75215
Off Market
Zillow last checked:
Listing updated:
Kenny Kelly 0672562 972-999-7106,
K. Kelly Homes 972-999-7106
$227,000
$216,000 - $238,000
$1,848/mo
| Date | Event | Price |
|---|---|---|
| 6/15/2026 | Price change | $229,000-6.1%$155/sqft |
Source: NTREIS #21232060 Report a problem | ||
| 6/1/2026 | Price change | $244,000-4.3%$165/sqft |
Source: NTREIS #21232060 Report a problem | ||
| 5/10/2026 | Price change | $254,999-3.8%$172/sqft |
Source: NTREIS #21232060 Report a problem | ||
| 4/22/2026 | Price change | $264,999-3.6%$179/sqft |
Source: NTREIS #21232060 Report a problem | ||
| 4/14/2026 | Listed for sale | $274,900+14.6%$186/sqft |
Source: NTREIS #21232060 Report a problem | ||
| 10/16/2023 | Listing removed | -- |
Source: NTREIS #20406603 Report a problem | ||
| 10/6/2023 | Price change | $239,9500%$162/sqft |
Source: NTREIS #20406603 Report a problem | ||
| 9/22/2023 | Price change | $239,999-1.2%$162/sqft |
Source: NTREIS #20406603 Report a problem | ||
| 9/17/2023 | Price change | $243,000-0.8%$164/sqft |
Source: NTREIS #20406603 Report a problem | ||
| 9/1/2023 | Listed for sale | $245,000+22.5%$166/sqft |
Source: NTREIS #20406603 Report a problem | ||
| 10/15/2021 | Sold | -- |
Source: NTREIS #14631701 Report a problem | ||
| 9/2/2021 | Pending sale | $200,000$135/sqft |
Source: NTREIS #14631701 Report a problem | ||
| 8/25/2021 | Listed for sale | $200,000$135/sqft |
Source: NTREIS #14631701 Report a problem | ||
| 8/1/2021 | Pending sale | $200,000$135/sqft |
Source: NTREIS #14631701 Report a problem | ||
| 7/22/2021 | Listed for sale | $200,000$135/sqft |
Source: NTREIS #14631701 Report a problem | ||
| Year | Property taxes | Tax assessment |
|---|---|---|
| 2025 | $2,890 -42.7% | $249,900 +4.3% |
| 2024 | $5,046 +45.2% | $239,710 +27.4% |
| 2023 | $3,474 -26.4% | $188,140 |
| 2022 | $4,723 +233% | $188,140 +249.9% |
| 2021 | $1,418 +14.2% | $53,770 +17.5% |
| 2020 | $1,242 -0.8% | $45,770 |
| 2019 | $1,251 +81.3% | $45,770 +88.7% |
| 2018 | $690 +4.6% | $24,260 |
| 2017 | $660 | $24,260 |
| 2016 | $660 | $24,260 |
| 2015 | -- | $24,260 |
| 2014 | -- | $24,260 |
| 2013 | -- | -- |
| 2012 | -- | -- |
| 2011 | -- | -- |
| 2010 | -- | -- |
| 2009 | -- | -- |
| 2008 | -- | -- |
| 2007 | -- | -- |
| 2005 | -- | -- |
| 2004 | -- | -- |
| 2003 | -- | -- |
| 2002 | -- | -- |
| 2001 | -- | -- |
Find assessor info on the county website
Source: NTREIS. This data may not be complete. We recommend contacting the local school district to confirm school assignments for this home.
A local agent can set up tours, give advice and negotiate with sellers.