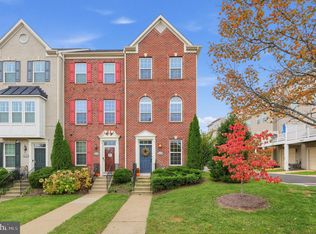
$724,700
4 bd3 ba2.2k sqft
2525 Ralph Ellison Way NE, Washington, DC 20018
Off Market
Zillow last checked:
Listing updated:
Melissa Ebong 202-415-8405,
Keller Williams Capital Properties

$733,700
$697,000 - $770,000
$4,345/mo
| Date | Event | Price |
|---|---|---|
| 8/12/2020 | Sold | $700,000+0%$257/sqft |
Source: Public Record Report a problem | ||
| 7/1/2020 | Pending sale | $699,900$257/sqft |
Source: Signature Home Realty LLC #DCDC471364 Report a problem | ||
| 6/4/2020 | Price change | $699,900+0.3%$257/sqft |
Source: Signature Home Realty LLC #DCDC471364 Report a problem | ||
| 2/29/2020 | Price change | $698,000-1.7%$256/sqft |
Source: Samson Properties #DCDC440744 Report a problem | ||
| 12/11/2019 | Listed for sale | $710,000$260/sqft |
Source: Samson Properties #DCDC440744 Report a problem | ||
| 12/4/2019 | Pending sale | $710,000$260/sqft |
Source: Samson Properties #DCDC440744 Report a problem | ||
| 11/21/2019 | Listed for sale | $710,000$260/sqft |
Source: Samson Properties #DCDC440744 Report a problem | ||
| 10/25/2019 | Pending sale | $710,000$260/sqft |
Source: Samson Properties #DCDC440744 Report a problem | ||
| 9/5/2019 | Listed for sale | $710,000+15.4%$260/sqft |
Source: Samson Properties #DCDC440744 Report a problem | ||
| 7/18/2016 | Sold | $615,000+1%$225/sqft |
Source: Public Record Report a problem | ||
| 5/13/2016 | Pending sale | $609,000$223/sqft |
Source: Fairfax Realty of Tysons #DC9634665 Report a problem | ||
| 5/9/2016 | Price change | $609,000-3.2%$223/sqft |
Source: Fairfax Realty of Tysons #DC9634665 Report a problem | ||
| 4/28/2016 | Listed for sale | $629,000+15.6%$231/sqft |
Source: Fairfax Realty of Tysons #DC9634665 Report a problem | ||
| 10/1/2013 | Sold | $543,950$199/sqft |
Source: Public Record Report a problem | ||
| Year | Property taxes | Tax assessment |
|---|---|---|
| 2026 | $5,761 -1.4% | $769,750 -1% |
| 2025 | $5,845 +1.4% | $777,440 +1.6% |
| 2024 | $5,765 +3.5% | $765,340 +3.5% |
| 2023 | $5,569 +6.4% | $739,210 +6.4% |
| 2022 | $5,235 +6.4% | $694,610 +6% |
| 2021 | $4,921 -8.9% | $655,270 +3.1% |
| 2020 | $5,402 +1.8% | $635,500 +1.8% |
| 2018 | $5,304 +7.4% | $623,970 +7.4% |
| 2017 | $4,940 +20.5% | $581,230 +4.9% |
| 2016 | $4,101 +9.3% | $554,140 +8.1% |
| 2015 | $3,752 +58.2% | $512,810 +5.4% |
| 2014 | $2,372 | $486,320 |
Source: Bright MLS. This data may not be complete. We recommend contacting the local school district to confirm school assignments for this home.
A local agent can set up tours, give advice and negotiate with sellers.