Great investment opportunity or an ideal home for a first-time homebuyer! This low-maintenance property offers the potential for lower utility costs, a spacious interior, and a wide lot. Whether you're looking to invest or make it your own, this home offers excellent potential. Immediate occupancy available!
Active
$119,900
25741 Norfolk St, Dearborn Heights, MI 48125
2beds
900sqft
Single Family Residence
Built in 1942
8,276 Square Feet Lot
$-- Zestimate®
$133/sqft
$-- HOA
What's special
Wide lotSpacious interior
- 21 days
- 459
- 29
Zillow last checked:
Listing updated:
Listed by:
Ehsan Ouza 734-272-6787,
Network Realty LLC 313-384-0191
Source: MichRIC,MLS#: 26055221
Facts & features
Interior
Bedrooms & bathrooms
- Bedrooms: 2
- Bathrooms: 1
- Full bathrooms: 1
- Main level bedrooms: 1
Heating
- Forced Air
Appliances
- Laundry: Laundry Room
Features
- Basement: Crawl Space
- Has fireplace: No
Interior area
- Total structure area: 900
- Total interior livable area: 900 sqft
Property
Features
- Stories: 2
Lot
- Size: 8,276 Square Feet
- Dimensions: 68.00 x 120.00
Details
- Parcel number: 33038010510000
Construction
Type & style
- Home type: SingleFamily
- Property subtype: Single Family Residence
Materials
- Vinyl Siding
- Roof: Shingle
Condition
- New construction: No
- Year built: 1942
Utilities & green energy
- Sewer: Public Sewer
- Water: Public
Community & HOA
Location
- Region: Dearborn Heights
Financial & listing details
- Price per square foot: $133/sqft
- Tax assessed value: $44,476
- Annual tax amount: $3,070
- Date on market: 10/16/2026
- Listing terms: Cash,FHA,Contract,Conventional
Estimated market value
Not available
Estimated sales range
Not available
$1,397/mo
Price history
| Date | Event | Price |
|---|---|---|
| 10/16/2026 | Listed for sale | $119,900+60.1%$133/sqft |
Source:  MichRIC #26055221 Report a problem | ||
| 7/23/2025 | Listing removed | $1,299$1/sqft |
Source: Zillow Rentals Report a problem | ||
| 7/15/2025 | Price change | $1,299-7.2%$1/sqft |
Source: Zillow Rentals Report a problem | ||
| 7/1/2025 | Listed for rent | $1,400$2/sqft |
Source: Zillow Rentals Report a problem | ||
| 5/12/2024 | Listing removed | $74,900+7%$83/sqft |
Source:  Realcomp II #2210069494 Report a problem | ||
| 10/21/2021 | Sold | $70,000-6.5%$78/sqft |
Source: Public Record Report a problem | ||
| 9/23/2021 | Pending sale | $74,900$83/sqft |
Source: Realcomp II #2210069494 Report a problem | ||
| 9/10/2021 | Price change | $74,900-6.3%$83/sqft |
Source: Realcomp II #2210069494 Report a problem | ||
| 8/20/2021 | Price change | $79,900-11.1%$89/sqft |
Source: Realcomp II #2210069494 Report a problem | ||
| 8/10/2021 | Listed for sale | $89,900$100/sqft |
Source: Realcomp II #2210065910 Report a problem | ||
| 7/28/2021 | Listing removed | -- |
Source: Realcomp II #2210048834 Report a problem | ||
| 6/24/2021 | Listed for sale | $89,900+109.1%$100/sqft |
Source: Realcomp II #2210048834 Report a problem | ||
| 6/22/2018 | Sold | $43,000-14%$48/sqft |
Source: Public Record Report a problem | ||
| 6/5/2018 | Pending sale | $50,000$56/sqft |
Source: RE/MAX Cornerstone #218046513 Report a problem | ||
| 5/26/2018 | Listed for sale | $50,000+19%$56/sqft |
Source: RE/MAX Cornerstone #218046513 Report a problem | ||
| 5/28/2015 | Listing removed | $42,000$47/sqft |
Source: Keller Williams - Plymouth/Canton #215026090 Report a problem | ||
| 4/22/2015 | Price change | $42,000-15.8%$47/sqft |
Source: Keller Williams - Plymouth/Canton #215026090 Report a problem | ||
| 3/25/2015 | Listed for sale | $49,900+394.1%$55/sqft |
Source: Keller Williams Rlty-Plymouth #215026090 Report a problem | ||
| 9/23/2008 | Sold | $10,100-82.6%$11/sqft |
Source: Public Record Report a problem | ||
| 11/30/2007 | Sold | $58,000+56.8%$64/sqft |
Source: Public Record Report a problem | ||
| 1/9/2004 | Sold | $37,000-31%$41/sqft |
Source: Public Record Report a problem | ||
| 5/10/2002 | Sold | $53,633+248.3%$60/sqft |
Source: Public Record Report a problem | ||
| 11/10/1994 | Sold | $15,400$17/sqft |
Source: Public Record Report a problem | ||
Public tax history
| Year | Property taxes | Tax assessment |
|---|---|---|
| 2025 | -- | $65,400 +47% |
| 2024 | -- | $44,500 +16.8% |
| 2023 | -- | $38,100 +11.4% |
| 2022 | -- | $34,200 +10% |
| 2021 | -- | $31,100 |
| 2020 | $1,777 +12.7% | $31,100 +16% |
| 2019 | $1,577 | $26,800 +5.5% |
| 2018 | $1,577 | $25,400 +2.4% |
| 2017 | -- | $24,800 -1.2% |
| 2016 | $1,629 | $25,100 +7.3% |
| 2015 | $1,629 -34.9% | $23,400 -9.7% |
| 2013 | $2,500 +53.5% | $25,900 -15.6% |
| 2010 | $1,629 | $30,700 -15.2% |
| 2008 | -- | $36,200 -3.5% |
| 2006 | $1,244 -36.3% | $37,500 +14.3% |
| 2005 | $1,952 +163% | $32,800 +14.7% |
| 2003 | $742 | $28,600 +64.2% |
| 2001 | -- | $17,414 +10.2% |
| 2000 | $1,048 | $15,809 |
Find assessor info on the county website
Monthly payment
Est. payment
Payment breakdown
Explore the cost of this home by adjusting the details. Changes won't be saved.Climate risks
Neighborhood: 48125
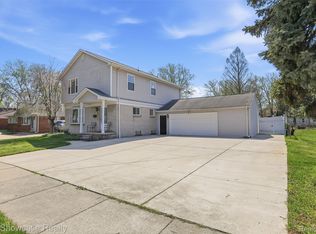
- $300,0005 bd3 ba2.6k sqft25715 Norfolk St, Dearborn Heights, MI 48125Sold
- $150,0003 bd2 ba1.1k sqft3017 S Beech Daly St, Dearborn Heights, MI 48125Sold
- $122,4003 bd1 ba969 sqft3009 S Beech Daly St, Dearborn Heights, MI 48125Off Market

- $132,4003 bd1 ba1k sqft3025 S Beech Daly St, Dearborn Heights, MI 48125Off Market

Similar homes
- $114,9002 bd1 ba729 sqft26244 McDonald St, Dearborn Heights, MI 48125For Sale
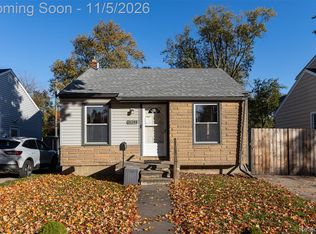
 MLS ID #20261088126, Jennifer Moody, River Oaks Realty. Realcomp II
- $114,0003 bd1 ba1k sqft25948 Penn St, Inkster, MI 48141For Sale
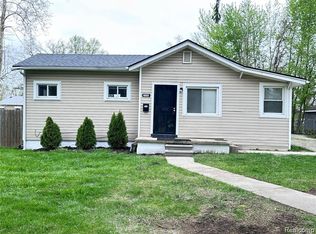 MLS ID #20261087936, Julie A Moraitis, EXP Realty. Realcomp II
- $99,9002 bd1 ba738 sqft24375 Hopkins St, Dearborn Heights, MI 48125For Sale
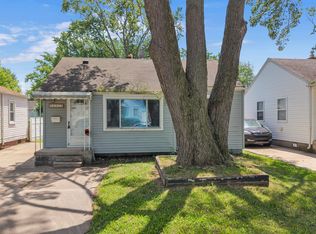 MLS ID #20261089924, Michael M Phillips, Keller Williams Legacy. Realcomp II
- $--3 bd1 ba925 sqft23411 Powers Ave, Dearborn Heights, MI 48125Auction
 Auction.com 1
- $120,0003 bd1 ba800 sqft6360 Princess St, Taylor, MI 48180For SaleMLS ID #20261088770, Moe Kassem, EXP Realty Main. Realcomp II
- $129,9003 bd1 ba912 sqft26916 Penn St, Inkster, MI 48141For Sale
 MLS ID #26058582, Annessa Bradley, eXp Realty, LLC. MichRIC
- $125,0003 bd1 ba1k sqft28611 Parkwood St, Inkster, MI 48141For SaleMLS ID #20261088344, Aireanna Sparks, Golden Key Realty Group LLC. Realcomp II
- $139,9003 bd2 ba1.2k sqft26095 Powers Ave, Dearborn Heights, MI 48125For SaleMLS ID #20261075383, Zaid Kassab, EXP Realty Main. Realcomp II
- $149,9002 bd1 ba768 sqft25526 New York St, Dearborn Heights, MI 48125For SaleMLS ID #20261074126, Alex H Saad, RE/MAX Team 2000. Realcomp II
- $119,9002 bd1 ba664 sqft6120 Marvin St, Taylor, MI 48180For SaleMLS ID #26057837, Gurjeet Singh, National Realty Centers Northv. MichRIC
- $145,6503 bd1 ba952 sqft25623 Pennie St, Dearborn Heights, MI 48125For Sale
 MLS ID #50226158, Kimberly Tokarz, Real Estate One Monroe. MiRealSource
- $125,0003 bd1 ba962 sqft25701 Eton Ave, Dearborn Heights, MI 48125For SaleMLS ID #20261055368, Anthony Djon, Anthony Djon Luxury Real Estate. Realcomp II
- $115,0003 bd1 ba1k sqft5328 S Inkster Rd, Westland, MI 48186For SaleMLS ID #26043282, Brian Meeks, Berkshire Hathaway Snyder & Co. MichRIC
- $139,9003 bd1 ba1.2k sqft24645 McDonald St, Dearborn Heights, MI 48125For SaleMLS ID #20261075712, Violetta G Vilenchuk, Michigan First Realty LLC. Realcomp II
- $115,0003 bd2 ba962 sqft28040 Rosewood St, Inkster, MI 48141For SaleMLS ID #20261085838, Ryan Makinen, Century 21 Curran & Oberski. Realcomp II
- $129,9002 bd1 ba680 sqft26010 Yale St, Inkster, MI 48141For SaleMLS ID #20261033350, Hassan Shukr, Own It Realty. Realcomp II
- $135,0002 bd1 ba988 sqft1601 Helen St, Inkster, MI 48141For SaleMLS ID #20261085785, Daniel Beirne, OpenDoor Brokerage LLC. Realcomp II
- $112,5003 bd1 ba883 sqft28945 Oakwood St, Inkster, MI 48141For SaleMLS ID #20261087785, John Graham, John Graham Realty, LLC. Realcomp II
