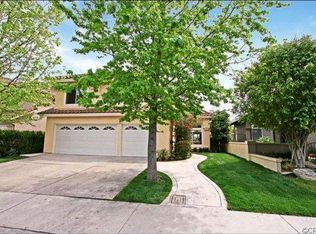
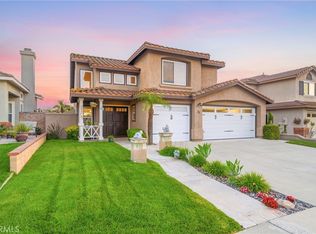
$1,325,900
3 bd|3 ba|2.5k sqft
28562 Brookhill Rd, Trabuco Canyon, CA 92679
Off Market
Zillow last checked:
Listing updated:
Jonathan Minerick DRE #01523060 888-400-2513,
Homecoin.com
$1,321,000
$1.25M - $1.39M
$5,898/mo
| Date | Event | Price |
|---|---|---|
| 6/26/2026 | Pending sale | $1,350,000$504/sqft |
Source: | ||
| 6/20/2026 | Price change | $1,350,000-3.2%$504/sqft |
Source: | ||
| 5/25/2026 | Price change | $1,395,000-3.5%$520/sqft |
Source: | ||
| 5/7/2026 | Price change | $1,445,000-3%$539/sqft |
Source: | ||
| 4/7/2026 | Listed for sale | $1,490,000+189.3%$556/sqft |
Source: | ||
| 10/3/2022 | Listing removed | -- |
Source: Zillow Rental Manager Report a problem | ||
| 9/9/2022 | Listed for rent | $4,500$2/sqft |
Source: Zillow Rental Manager Report a problem | ||
| 9/1/2022 | Listing removed | -- |
Source: Zillow Rental Manager Report a problem | ||
| 8/29/2022 | Price change | $4,500-8.2%$2/sqft |
Source: Zillow Rental Manager Report a problem | ||
| 8/15/2022 | Price change | $4,900-5.8%$2/sqft |
Source: Zillow Rental Manager Report a problem | ||
| 8/2/2022 | Price change | $5,200-9.6%$2/sqft |
Source: Zillow Rental Manager Report a problem | ||
| 8/1/2022 | Listed for rent | $5,750+55.6%$2/sqft |
Source: Zillow Rental Manager Report a problem | ||
| 3/24/2021 | Listing removed | -- |
Source: Owner Report a problem | ||
| 4/13/2019 | Listing removed | $3,695$1/sqft |
Source: Owner Report a problem | ||
| 4/4/2019 | Price change | $3,695-2.6%$1/sqft |
Source: Owner Report a problem | ||
| 4/1/2019 | Listed for rent | $3,795+5.6%$1/sqft |
Source: Owner Report a problem | ||
| 2/9/2018 | Listing removed | $3,595$1/sqft |
Source: Owner Report a problem | ||
| 1/30/2018 | Price change | $3,595-6.6%$1/sqft |
Source: Owner Report a problem | ||
| 1/9/2018 | Price change | $3,850-2.5%$1/sqft |
Source: Owner Report a problem | ||
| 11/15/2017 | Price change | $3,950-8%$1/sqft |
Source: Owner Report a problem | ||
| 11/13/2017 | Listed for rent | $4,295$2/sqft |
Source: Owner Report a problem | ||
| 3/31/2011 | Sold | $515,000-3.7%$192/sqft |
Source: Public Record Report a problem | ||
| 2/23/2011 | Price change | $534,900-1.8%$200/sqft |
Source: Vernazza Realty #S648237 Report a problem | ||
| 2/19/2011 | Listed for sale | $544,900$203/sqft |
Source: Vernazza Realty #S648237 Report a problem | ||
| 11/24/2010 | Listing removed | $544,900-4.2%$203/sqft |
Source: foreclosure.com Report a problem | ||
| 9/14/2010 | Sold | $569,000$212/sqft |
Source: Public Record Report a problem | ||
| Year | Property taxes | Tax assessment |
|---|---|---|
| 2025 | $6,896 +1.8% | $659,801 +2% |
| 2024 | $6,772 +2.4% | $646,864 +2% |
| 2023 | $6,613 +1.8% | $634,181 +2% |
| 2022 | $6,495 +2% | $621,747 +2% |
| 2021 | $6,366 +0.9% | $609,556 +1% |
| 2020 | $6,309 | $603,306 +2% |
| 2019 | $6,309 +2% | $591,477 +2% |
| 2018 | $6,183 +4% | $579,880 +2% |
| 2017 | $5,947 | $568,510 +2% |
| 2016 | $5,947 +5.8% | $557,363 +1.5% |
| 2015 | $5,623 -5.8% | $548,991 +2% |
| 2014 | $5,968 | $538,238 +4.5% |
| 2013 | -- | $515,000 |
| 2012 | -- | $515,000 -5.5% |
| 2011 | -- | $544,900 +55.2% |
| 2010 | -- | $351,207 -0.2% |
| 2009 | -- | $352,042 +2% |
| 2008 | -- | $345,140 +2% |
| 2007 | -- | $338,373 +2% |
| 2006 | -- | $331,739 +2% |
| 2005 | -- | $325,235 +2% |
| 2004 | -- | $318,858 +1.9% |
| 2003 | -- | $313,015 +2% |
| 2002 | -- | $306,878 +2% |
| 2001 | $5,166 +2% | $300,861 +2% |
| 2000 | $5,066 | $294,962 |
Find assessor info on the county website
A local agent can set up tours, give advice and negotiate with sellers.
Local buyer's agents are ready to help