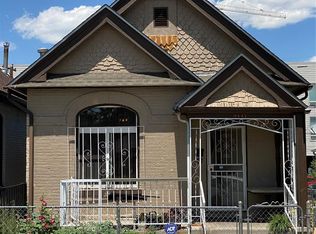
Price decreased by $300,000 due to encroaching fence on Northside of the property. The property consists of two lots. Would make a great luxury duplex development with ADU's or two single family homes with ADU's. Development Opportunity Located at the boundary of the River North Arts District "RiNo" and Historic Curtis Park. The property is considered G-RH-3 Zoning, a multi-unit zoning code that allows for urban house, duplex and row house building forms. Build a house with an Accessory Dwelling Unit (adu). The property has an existing single-family house build between both lots. To note, across the street they are building a three story law office.
For sale by owner
Price cut: $300K (4/8)
$1,200,000
3459 Lawrence St, Denver, CO 80205
3beds
1,152sqft
SingleFamily
Built in 1998
6,250 Square Feet Lot
$-- Zestimate®
$1,042/sqft
$-- HOA
Overview
- 534 days |
- 91 |
- 2 |
Listed by:
Property Owner (720) 432-5775
Facts & features
Interior
Bedrooms & bathrooms
- Bedrooms: 3
- Bathrooms: 2
- Full bathrooms: 1
- 1/2 bathrooms: 1
Heating
- Forced air
Interior area
- Total interior livable area: 1,152 sqft
Property
Features
- Exterior features: Wood
Lot
- Size: 6,250 Square Feet
Details
- Parcel number: 0226305038000
Construction
Type & style
- Home type: SingleFamily
Condition
- New construction: No
- Year built: 1998
Community & HOA
Location
- Region: Denver
Financial & listing details
- Price per square foot: $1,042/sqft
- Tax assessed value: $781,500
- Annual tax amount: $3,772
- Date on market: 1/17/2025
Estimated market value
Not available
Estimated sales range
Not available
$3,102/mo
Price history
| Date | Event | Price |
|---|---|---|
| 4/8/2026 | Price change | $1,200,000-20%$1,042/sqft |
Source: Owner Report a problem | ||
| 9/29/2025 | Listed for sale | $1,500,000$1,302/sqft |
Source: Owner Report a problem | ||
| 9/15/2025 | Listing removed | -- |
Source: Owner Report a problem | ||
| 6/17/2025 | Listed for sale | $1,500,000$1,302/sqft |
Source: Owner Report a problem | ||
| 6/5/2025 | Listing removed | -- |
Source: Owner Report a problem | ||
| 3/7/2025 | Listed for sale | $1,500,000$1,302/sqft |
Source: Owner Report a problem | ||
| 2/24/2025 | Listing removed | -- |
Source: Owner Report a problem | ||
| 1/17/2025 | Listed for sale | $1,500,000$1,302/sqft |
Source: Owner Report a problem | ||
| 11/4/2024 | Listing removed | -- |
Source: Owner Report a problem | ||
| 5/15/2024 | Price change | $1,500,000+36.4%$1,302/sqft |
Source: Owner Report a problem | ||
| 5/12/2024 | Price change | $1,100,000+10.6%$955/sqft |
Source: Owner Report a problem | ||
| 3/22/2024 | Price change | $995,000+99%$864/sqft |
Source: Owner Report a problem | ||
| 3/8/2024 | Listed for sale | $500,000+713%$434/sqft |
Source: Owner Report a problem | ||
| 12/28/1998 | Sold | $61,500+105%$53/sqft |
Source: Public Record Report a problem | ||
| 6/29/1998 | Sold | $30,000$26/sqft |
Source: Public Record Report a problem | ||
Public tax history
| Year | Property taxes | Tax assessment |
|---|---|---|
| 2024 | $3,772 +1.9% | $48,680 -6.1% |
| 2023 | $3,704 +3.6% | $51,860 +11.4% |
| 2022 | $3,574 +50.7% | $46,570 -2.8% |
| 2021 | $2,371 +2.9% | $47,900 +49.9% |
| 2020 | $2,305 +11.4% | $31,961 -0.7% |
| 2019 | $2,070 | $32,184 +20.3% |
| 2018 | $2,070 +0.3% | $26,750 |
| 2017 | $2,063 +30.9% | $26,750 +32.6% |
| 2016 | $1,577 +17% | $20,180 |
| 2015 | $1,348 0% | $20,180 +24.3% |
| 2014 | $1,349 +1.3% | $16,230 |
| 2013 | $1,332 +17.9% | $16,230 +2.5% |
| 2012 | $1,130 -6% | $15,840 |
| 2011 | $1,202 +2.2% | $15,840 -12.2% |
| 2010 | $1,176 -8.9% | $18,050 |
| 2009 | $1,291 -0.2% | $18,050 -6.6% |
| 2008 | $1,293 +15.8% | $19,330 |
| 2007 | $1,117 +1.1% | $19,330 +15.9% |
| 2006 | $1,104 +15.2% | $16,680 |
| 2005 | $959 +24.3% | $16,680 +8.9% |
| 2003 | $772 +1.9% | $15,310 +18.8% |
| 2002 | $757 | $12,890 +20% |
| 2001 | -- | $10,740 |
Find assessor info on the county website
Monthly payment
Est. payment$--/mo
Payment breakdown
Explore the cost of this home by adjusting the details. Changes won't be saved.All calculations are estimates and provided by Zillow, Inc. for informational purposes only. Actual amounts may vary.
HOA fees may include property taxes on listings classified as Co-Ops. Contact the listing agent and/or owner for fee details.
Mortgage interest rates are dependent on a number of factors, including credit score, down payment, and repayment length. Interest rate data provided by Zillow Group Marketplace, Inc. as of 1/1/1970 from various mortgage lenders with which we have lead or other similar arrangements; the Estimated Payment is an average of those rates.
See how much you could borrow to make a competitive offer.
Climate risks
Neighborhood: Five Points
Nearby schools
GreatSchools rating
- 2/10Cole Arts And Science AcademyGrades: PK-5Distance: 0.3 mi
- 2/10Manual Middle SchoolGrades: 6-8Distance: 0.8 mi
- 5/10Manual High SchoolGrades: 9-12Distance: 0.8 mi

A local agent can set up tours, give advice and negotiate with sellers.


- Colorado
- Denver County
- Denver
- 80205
- Five Points
- 3459 Lawrence St
Nearby cities
Nearby neighborhoods
Nearby zip codes
Other Denver Topics
