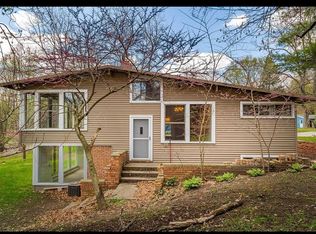
$300,500
3 bd2 ba1.4k sqft
83 N 400 E, Valparaiso, IN 46383
Off Market
Likely to sell faster than
Zillow last checked:
Listing updated:
Nicholas Scalise,
Listing Leaders 219-462-5478

$309,700
$294,000 - $325,000
$2,424/mo
| Date | Event | Price |
|---|---|---|
| 10/15/2026 | Listed for sale | $321,000+16.7%$142/sqft |
Source:  NIRA as distributed by MLS GRID #846857 Report a problem | ||
| 1/13/2023 | Sold | $275,000-2.8%$122/sqft |
Source: NIRA as distributed by MLS GRID #522332 Report a problem | ||
| 12/6/2022 | Price change | $282,900-2.4%$125/sqft |
Source: NIRA as distributed by MLS GRID #522332 Report a problem | ||
| 11/17/2022 | Price change | $289,900-3.3%$128/sqft |
Source: NIRA as distributed by MLS GRID #522332 Report a problem | ||
| 11/3/2022 | Listed for sale | $299,900+69.4%$133/sqft |
Source: NIRA as distributed by MLS GRID #522332 Report a problem | ||
| 1/22/2016 | Sold | $177,000-1.6%$78/sqft |
Source: NIRA as distributed by MLS GRID #383237 Report a problem | ||
| 12/21/2015 | Pending sale | $179,900$79/sqft |
Source: Berkshire Hathaway HomeService #383237 Report a problem | ||
| 11/4/2015 | Listed for sale | $179,900$79/sqft |
Source: Berkshire Hathaway HomeService #383237 Report a problem | ||
| Year | Property taxes | Tax assessment |
|---|---|---|
| 2025 | $1,524 -1.6% | $273,700 +9.9% |
| 2024 | $1,549 -1.8% | $249,100 +2.3% |
| 2023 | $1,577 +2.7% | $243,600 +4.9% |
| 2022 | $1,535 +14.4% | $232,300 +6% |
| 2021 | $1,342 +2.3% | $219,100 +7.9% |
| 2020 | $1,312 -3.3% | $203,100 +4.4% |
| 2019 | $1,356 +0.7% | $194,500 +4.5% |
| 2018 | $1,347 | $186,200 -0.6% |
| 2017 | $1,347 +20.1% | $187,300 +15.2% |
| 2016 | $1,122 +7.1% | $162,600 +14.6% |
| 2014 | $1,048 +14.3% | $141,900 +1.5% |
| 2013 | $916 -1.5% | $139,800 -2.2% |
| 2012 | $931 +5.8% | $142,900 +4.8% |
| 2011 | $880 +0.5% | $136,400 +1.9% |
| 2010 | $876 +21.3% | $133,900 +3.6% |
| 2009 | $722 | $129,300 +34.3% |
| 2006 | -- | $96,300 +10.7% |
| 2005 | -- | $87,000 |
Source: NIRA as distributed by MLS GRID. This data may not be complete. We recommend contacting the local school district to confirm school assignments for this home.
A local agent can set up tours, give advice and negotiate with sellers.
A local lender can help you make sure your offer is ready when you are.