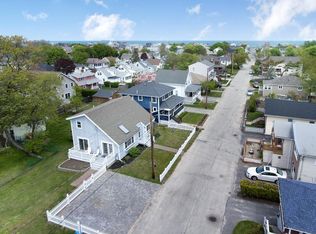
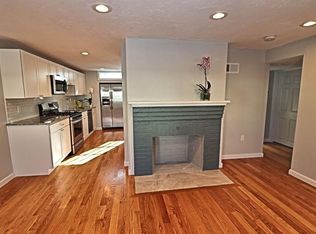
Opportunities like 44 Central Ave don't present often. The Nantasket Beach area has been a sought after summer destination for generations and this property offers a buyer the chance to restore a quintessential New England beach house or design a modern escape from the city, without Cape traffic. With 5 bedrooms and bathrooms on every level, this architectural gem offers the flexibility for a friends and family retreat or year-round occupation. Unfiltered photos were used to provide authenticity and respect for the property's timeless charm and condition.
For sale
Price cut: $50K (10/22)
$450,000
44 Central Ave, Hull, MA 02045
5beds
1,684sqft
Single Family Residence
Built in 1925
5,001 Square Feet Lot
$658,700 Zestimate®
$267/sqft
$-- HOA
What's special
- 26 days
- 3,263
- 167
Likely to sell faster than
Zillow last checked:
Listing updated:
Listed by:
Jason P. Lanagan 508-985-8898,
Lanagan & Co 617-848-1240
Source: MLS PIN,MLS#: 73586986
Facts & features
Interior
Bedrooms & bathrooms
- Bedrooms: 5
- Bathrooms: 3
- Full bathrooms: 2
- 1/2 bathrooms: 1
Heating
- Forced Air, Natural Gas
Cooling
- Window Unit(s)
Features
- Basement: Full,Partially Finished
- Number of fireplaces: 1
Interior area
- Total structure area: 1,684
- Total interior livable area: 1,684 sqft
- Finished area above ground: 1,684
Property
Parking
- Total spaces: 2
- Uncovered spaces: 2
Features
- Fencing: Fenced/Enclosed
- Waterfront features: Ocean, 3/10 to 1/2 Mile To Beach, Beach Ownership(Public)
Lot
- Size: 5,001 Square Feet
Details
- Parcel number: M:0016 L:0168,1042702
- Zoning: SFA
Construction
Type & style
- Home type: SingleFamily
- Architectural style: Colonial
- Property subtype: Single Family Residence
Materials
- Frame
- Foundation: Irregular
Condition
- Year built: 1925
Utilities & green energy
- Sewer: Public Sewer
- Water: Public
Community & HOA
HOA
- Has HOA: No
Location
- Region: Hull
Financial & listing details
- Price per square foot: $267/sqft
- Tax assessed value: $523,600
- Annual tax amount: $5,660
- Date on market: 10/6/2026
- Listing terms: Other (See Remarks)
Estimated market value
$658,700
$580,000 - $738,000
$3,709/mo
Price history
| Date | Event | Price |
|---|---|---|
| 10/22/2026 | Price change | $450,000-10%$267/sqft |
Source: MLS PIN #73586986 Report a problem | ||
| 10/6/2026 | Listed for sale | $500,000$297/sqft |
Source: MLS PIN #73586986 Report a problem | ||
Public tax history
| Year | Property taxes | Tax assessment |
|---|---|---|
| 2025 | $5,462 +1.6% | $487,700 +5.7% |
| 2024 | $5,375 +0.4% | $461,400 +4.9% |
| 2023 | $5,354 +3.2% | $439,900 +6.4% |
| 2022 | $5,187 +4.5% | $413,600 +5.6% |
| 2021 | $4,964 +6% | $391,500 +7.1% |
| 2020 | $4,684 +3.6% | $365,400 +5.5% |
| 2019 | $4,521 +4.4% | $346,400 +7.4% |
| 2018 | $4,329 +1.5% | $322,600 +3.8% |
| 2017 | $4,264 +6.2% | $310,800 +4.4% |
| 2016 | $4,014 +4.7% | $297,800 +8.3% |
| 2015 | $3,834 +4.2% | $275,000 +3.7% |
| 2014 | $3,680 +3% | $265,300 |
| 2013 | $3,574 +1.9% | $265,300 -1.2% |
| 2012 | $3,507 +1.1% | $268,500 -4.4% |
| 2011 | $3,469 -5.3% | $280,900 -12.1% |
| 2010 | $3,664 -1.2% | $319,400 -9.7% |
| 2009 | $3,710 +3.3% | $353,700 -3.2% |
| 2008 | $3,593 -0.2% | $365,500 -1% |
| 2007 | $3,599 +6.6% | $369,100 +1.7% |
| 2006 | $3,377 +3.3% | $363,100 +11.6% |
| 2005 | $3,270 +9.5% | $325,400 +9.7% |
| 2004 | $2,987 +7.7% | $296,600 +16.3% |
| 2003 | $2,774 +76.7% | $255,000 +135.2% |
| 2001 | $1,570 +3.2% | $108,400 +22.6% |
| 2000 | $1,521 | $88,400 |
Find assessor info on the county website
Monthly payment
Est. payment
Payment breakdown
Explore the cost of this home by adjusting the details. Changes won't be saved.Climate risks
Neighborhood: 02045

Similar homes
- $449,0003 bd1 ba1k sqft31 Water St, Quincy, MA 02169For Sale
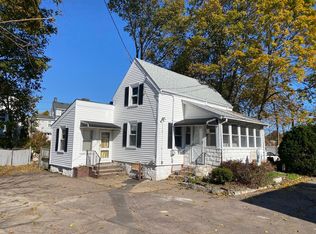 MLS ID #73591889, John Volpe, William Raveis R.E. & Home Services. MLS PIN
- $460,0002 bd1 ba1.3k sqft45 Robinswood Rd, Weymouth, MA 02190For Sale
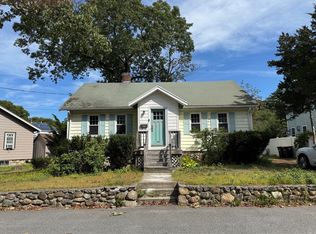 MLS ID #73579213, Karyn McMahon, Keller Williams Realty. MLS PIN
- $420,0003 bd1 ba976 sqft576 Sea St, Quincy, MA 02169For Sale
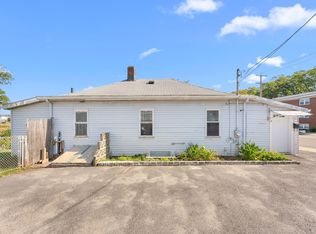 MLS ID #73591102, Samuel Merida, eXp Realty LLC. MLS PIN
- $499,0003 bd2 ba1.2k sqft73 Chestnut Cir, Randolph, MA 02368For Sale
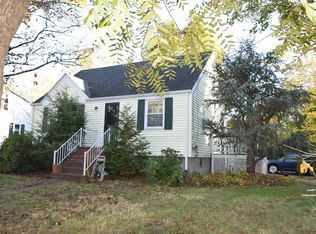 MLS ID #73592142, Todd Sandler, Todd A. Sandler REALTORS®. MLS PIN
