This 1538 square foot single family home has 3 bedrooms and 2.0 bathrooms. This home is located at 4460 Cranbrook Way, Las Vegas, NV 89103.
Pre-foreclosure
Street View
Est. $265,900
4460 Cranbrook Way, Las Vegas, NV 89103
3beds
2baths
1,538sqft
SingleFamily
Built in 1977
6,969 Square Feet Lot
$265,900 Zestimate®
$173/sqft
$-- HOA
Overview
- 101 days
- 9,192
- 684
Facts & features
Interior
Bedrooms & bathrooms
- Bedrooms: 3
- Bathrooms: 2
Heating
- Forced air
Cooling
- Central
Features
- Flooring: Carpet, Concrete, Linoleum / Vinyl
Interior area
- Total interior livable area: 1,538 sqft
Property
Parking
- Total spaces: 1
- Parking features: Garage - Attached
Features
- Exterior features: Stucco
Lot
- Size: 6,969 Square Feet
Details
- Parcel number: 16323213054
Construction
Type & style
- Home type: SingleFamily
Materials
- Frame
- Roof: Composition
Condition
- Year built: 1977
Community & HOA
Location
- Region: Las Vegas
Financial & listing details
- Price per square foot: $173/sqft
- Tax assessed value: $215,771
- Annual tax amount: $2,146
Foreclosure details
Estimated market value
$265,900
$253,000 - $279,000
$2,263/mo
Price history
| Date | Event | Price |
|---|---|---|
| 7/23/2026 | Price change | $275,000-36.8%$179/sqft |
Source:  LVR #2801682 Report a problem | ||
| 6/18/2026 | Listed for sale | $435,000$283/sqft |
Source: LVR #2787049 Report a problem | ||
| 6/12/2026 | Contingent | $435,000$283/sqft |
Source: LVR #2787049 Report a problem | ||
| 6/1/2026 | Listed for sale | $435,000-8.4%$283/sqft |
Source: LVR #2787049 Report a problem | ||
| 7/25/2022 | Sold | $475,000-5%$309/sqft |
Source: LVR #2400050 Report a problem | ||
| 6/24/2022 | Contingent | $499,900$325/sqft |
Source: LVR #2400050 Report a problem | ||
| 6/13/2022 | Listed for sale | $499,900$325/sqft |
Source: LVR #2400050 Report a problem | ||
| 6/10/2022 | Contingent | $499,900$325/sqft |
Source: LVR #2400050 Report a problem | ||
| 5/25/2022 | Listed for sale | $499,900+180.1%$325/sqft |
Source: LVR #2400050 Report a problem | ||
| 4/30/2003 | Sold | $178,500$116/sqft |
Source: Public Record Report a problem | ||
Public tax history
| Year | Property taxes | Tax assessment |
|---|---|---|
| 2026 | $2,146 +8% | $75,520 -3.9% |
| 2025 | $1,987 +8% | $78,555 +8.4% |
| 2024 | $1,840 +8% | $72,481 +18.5% |
| 2023 | $1,704 +8% | $61,152 +3.9% |
| 2022 | $1,578 +7.7% | $58,862 +1.7% |
| 2021 | $1,465 +6.7% | $57,897 +6.1% |
| 2020 | $1,373 +4.8% | $54,557 +3.7% |
| 2019 | $1,310 +6.9% | $52,631 |
| 2018 | $1,225 | $52,631 +2.1% |
| 2017 | $1,225 | $51,564 +6.6% |
| 2016 | $1,225 +0.3% | $48,363 +9.3% |
| 2015 | $1,222 +3% | $44,263 +12.8% |
| 2014 | $1,186 | $39,244 |
| 2013 | -- | $39,244 -4.8% |
| 2012 | -- | $41,219 -0.7% |
| 2011 | -- | $41,514 -8% |
| 2010 | -- | $45,136 -18% |
| 2009 | -- | $55,066 |
| 2008 | -- | $55,066 -32.4% |
| 2007 | -- | $81,508 +6.6% |
| 2006 | -- | $76,466 +35.6% |
| 2005 | -- | $56,378 +31.3% |
| 2004 | -- | $42,924 +5.5% |
| 2003 | -- | $40,702 +2.3% |
| 2002 | -- | $39,800 +4.3% |
| 2001 | -- | $38,170 |
Find assessor info on the county website
Monthly payment
Climate risks
Neighborhood: Spring Valley
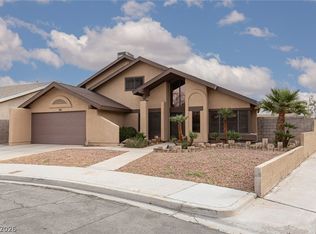
Similar homes
- $288,0004 bd3 ba1.4k sqft4439 Sirius Ave, Las Vegas, NV 89102For Sale
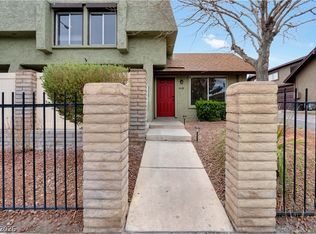 MLS ID #2824262, Haoliang Wu, Modern Edge Real Estate. LVR
- $229,9992 bd2 ba1k sqft5042 Rainbow Blvd #102, Las Vegas, NV 89118For Sale
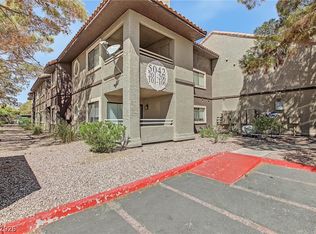 MLS ID #2818724, Raphael Rodil, LIFE Realty District. LVR
- $299,9003 bd3 ba1.3k sqft4551 Sirius Ave, Las Vegas, NV 89102For Sale
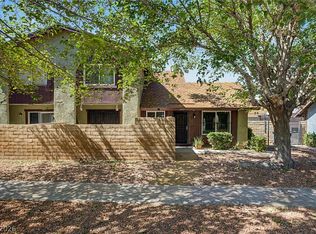 MLS ID #2785078, John J. Faulis Jr, Vegas Dream Homes Inc. LVR
- $299,0003 bd3 ba1.4k sqft5889 Laredo St, Las Vegas, NV 89146For Sale
 MLS ID #2812659, Nicholas Guidice, Huntington & Ellis, A Real Est. LVR
