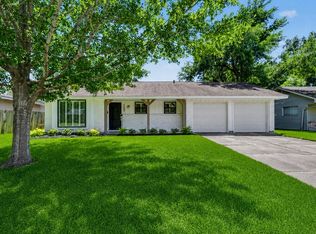
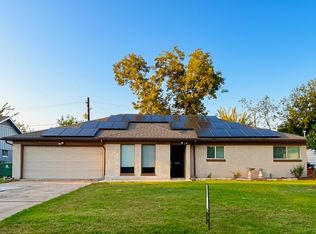
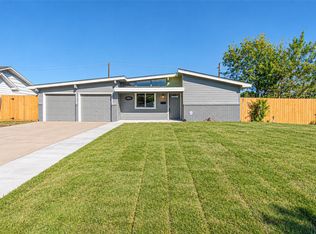
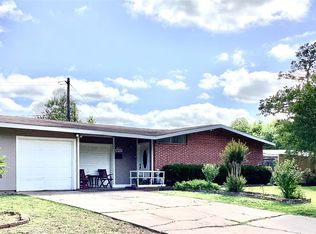
$199,600
3 bd1 ba1.2k sqft
6721 Neff St, Houston, TX 77074
Off Market
Zillow last checked:
Listing updated:
Alejandra Bustamante TREC #0556121 832-782-0581,
HomeSmart

Not available
Estimated sales range
Not available
$2,194/mo
| Date | Event | Price |
|---|---|---|
| 11/13/2026 | Pending sale | $315,000$196/sqft |
Source:  HAR #96045738 Report a problem | ||
| 11/13/2026 | Listed for sale | $315,000+43.9%$196/sqft |
Source: HAR #96045738 Report a problem | ||
| 5/6/2018 | Listing removed | $218,900$136/sqft |
Source: J Howard Real Estate #80519924 Report a problem | ||
| 2/8/2018 | Pending sale | $218,900$136/sqft |
Source: J Howard Real Estate #80519924 Report a problem | ||
| 12/18/2017 | Price change | $218,900-4.8%$136/sqft |
Source: J Howard Real Estate #80519924 Report a problem | ||
| 11/28/2017 | Price change | $229,900-3.8%$143/sqft |
Source: J Howard Real Estate #80519924 Report a problem | ||
| 11/3/2017 | Listed for sale | $239,000+262.8%$149/sqft |
Source: J Howard Real Estate #80519924 Report a problem | ||
| 7/24/2017 | Sold | -- |
Source: Public Record Report a problem | ||
| 6/13/2017 | Listed for sale | -- |
Source: Auction.com Report a problem | ||
| 4/7/2015 | Listing removed | -- |
Source: Auction.com Report a problem | ||
| 4/6/2015 | Price change | $65,882+1.4%$41/sqft |
Source: Auction.com Report a problem | ||
| 3/21/2015 | Listed for sale | -- |
Source: Auction.com Report a problem | ||
| 9/3/2011 | Listing removed | $65,000$40/sqft |
Source: RE/MAX Real Estate Associates #90087429 Report a problem | ||
| 8/24/2011 | Listed for sale | $65,000$40/sqft |
Source: isNowListed.com Report a problem | ||
| 12/17/2010 | Sold | -- |
Source: Public Record Report a problem | ||
| 7/26/2006 | Sold | -- |
Source: Public Record Report a problem | ||
| Year | Property taxes | Tax assessment |
|---|---|---|
| 2025 | $3,122 -16.2% | $255,494 -6.8% |
| 2024 | $3,727 -1.1% | $274,080 -14.8% |
| 2023 | $3,768 -10.2% | $321,675 +2.6% |
| 2022 | $4,196 | $313,601 +25.9% |
| 2021 | -- | $249,053 +12% |
| 2020 | -- | $222,412 -5% |
| 2019 | $4,264 +27.2% | $234,187 +22.8% |
| 2018 | $3,351 | $190,654 +43.7% |
| 2017 | $3,351 +8.5% | $132,651 +8.6% |
| 2016 | $3,088 +54.5% | $122,110 +14.2% |
| 2015 | $1,999 | $106,890 +37.5% |
| 2014 | $1,999 | $77,750 +5.2% |
| 2013 | -- | $73,875 +7.2% |
| 2012 | -- | $68,926 -16.7% |
| 2011 | -- | $82,777 |
| 2010 | -- | $82,777 -9.8% |
| 2009 | -- | $91,789 -6.5% |
| 2008 | -- | $98,218 |
| 2007 | -- | $98,218 +4.1% |
| 2006 | -- | $94,322 +3.3% |
| 2005 | -- | $91,300 |
| 2004 | -- | $91,300 +6.9% |
| 2003 | -- | $85,400 +17.3% |
| 2002 | -- | $72,800 +10% |
| 2001 | -- | $66,200 +10% |
| 2000 | -- | $60,200 |
Source: HAR. This data may not be complete. We recommend contacting the local school district to confirm school assignments for this home.

A local agent can set up tours, give advice and negotiate with sellers.