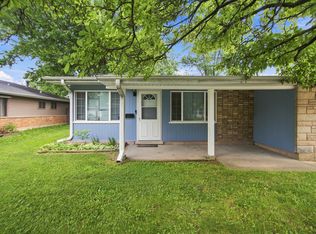
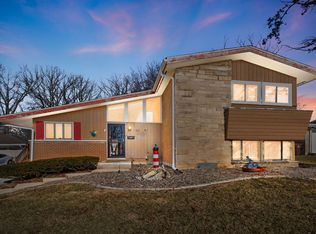
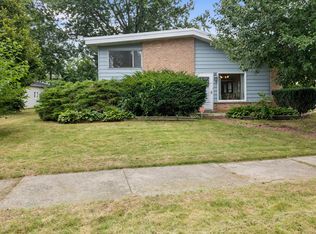
$162,900
4 bd2 ba1.4k sqft
9 E Rocket Cir, Park Forest, IL 60466
Off Market
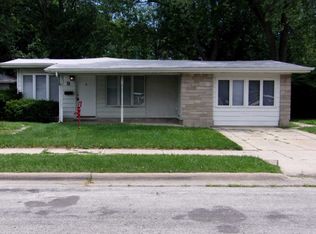
Listing description withheld by the listing agent.
Zillow last checked:
Listing updated:
Jamaal Garrett (312)841-6216,
Real People Realty

Not available
Estimated sales range
Not available
Not available
| Date | Event | Price |
|---|---|---|
| 10/16/2026 | Contingent | $189,999$118/sqft |
Source: MRED as distributed by MLS GRID #12775513 Report a problem | ||
| 10/7/2026 | Listed for sale | $189,999+140.5%$118/sqft |
Source: MRED as distributed by MLS GRID #12775513 Report a problem | ||
| 7/27/2016 | Sold | $79,000$49/sqft |
Source:  MRED as distributed by MLS GRID #09190297 Report a problem | ||
| 5/17/2016 | Pending sale | $79,000$49/sqft |
Source: Keller Williams - Keller Williams Preferred Realty #09190297 Report a problem | ||
| 5/7/2016 | Price change | $79,000-11.2%$49/sqft |
Source: Keller Williams - Keller Williams Preferred Realty #09190297 Report a problem | ||
| 4/10/2016 | Listed for sale | $89,000+156.9%$55/sqft |
Source: Keller Williams - Keller Williams Preferred Realty #09190297 Report a problem | ||
| 5/7/2015 | Sold | $34,650-9.5%$21/sqft |
Source: MRED as distributed by MLS GRID #08801574 Report a problem | ||
| 4/8/2015 | Pending sale | $38,300$24/sqft |
Source: Fulton Property Solutions Inc #08801574 Report a problem | ||
| 2/14/2015 | Price change | $38,300-11.5%$24/sqft |
Source: FULTON PROPERTY SOLUTIONS #08801574 Report a problem | ||
| 12/18/2014 | Listed for sale | $43,300$27/sqft |
Source: FULTON PROPERTY SOLUTIONS #08801574 Report a problem | ||
| Year | Property taxes | Tax assessment |
|---|---|---|
| 2024 | $7,701 +8.6% | $13,000 +0% |
| 2023 | $7,089 +75.4% | $12,999 +102.3% |
| 2022 | $4,042 -1% | $6,426 |
| 2021 | $4,085 +2.1% | $6,426 |
| 2020 | $3,999 +0.2% | $6,426 -9.4% |
| 2019 | $3,991 +3.9% | $7,096 |
| 2018 | $3,840 -57.6% | $7,096 -18.3% |
| 2017 | $9,052 +14.5% | $8,683 +9.2% |
| 2016 | $7,908 +2.3% | $7,954 |
| 2015 | $7,728 +3% | $7,954 |
| 2014 | $7,501 +3.7% | $7,954 -7.1% |
| 2013 | $7,232 +4.6% | $8,560 |
| 2012 | $6,913 +79.9% | $8,560 |
| 2011 | $3,844 -21% | $8,560 -15% |
| 2010 | $4,863 +3.9% | $10,070 |
| 2009 | $4,680 +8.3% | $10,070 -5% |
| 2008 | $4,323 +3.9% | $10,600 -3.3% |
| 2007 | $4,161 +3.2% | $10,959 |
| 2006 | $4,031 +7.9% | $10,959 |
| 2005 | $3,737 -3.9% | $10,959 +14.6% |
| 2004 | $3,890 +15% | $9,561 |
| 2003 | $3,384 +4.8% | $9,561 |
| 2002 | $3,229 +6.4% | $9,561 +3.9% |
| 2001 | $3,035 +4.3% | $9,203 |
| 2000 | $2,910 +7.8% | $9,203 |
| 1999 | $2,699 | $9,203 |
Source: MRED as distributed by MLS GRID. This data may not be complete. We recommend contacting the local school district to confirm school assignments for this home.

A local agent can set up tours, give advice and negotiate with sellers.
A local lender can help you make sure your offer is ready when you are.