This is a 1353 square foot, 2.0 bathroom, single family home. This home is located at 7916 Lightfoot Dr, New Port Richey, FL 34653.
Pre-foreclosure
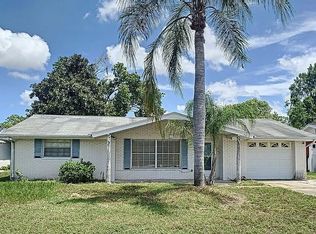
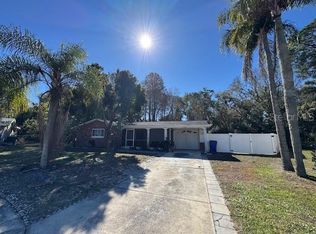
Street View
Est. $259,400
7916 Lightfoot Dr, New Port Richey, FL 34653
--beds
2baths
1,353sqft
SingleFamily
Built in 1982
0.5 Acres Lot
$259,400 Zestimate®
$192/sqft
$-- HOA
Overview
- 281 days |
- 12 |
- 0 |
Facts & features
Interior
Bedrooms & bathrooms
- Bathrooms: 2
Heating
- Forced air
Cooling
- Central
Features
- Flooring: Tile, Other, Carpet
Interior area
- Total interior livable area: 1,353 sqft
Property
Parking
- Parking features: Garage - Attached
Features
- Exterior features: Other, Stucco
- Has view: Yes
- View description: Water
- Has water view: Yes
- Water view: Water
Lot
- Size: 0.5 Acres
Details
- Parcel number: 032616028B000000690
Construction
Type & style
- Home type: SingleFamily
Materials
- Frame
- Roof: Asphalt
Condition
- Year built: 1982
Community & HOA
Location
- Region: New Port Richey
Financial & listing details
- Price per square foot: $192/sqft
- Tax assessed value: $244,531
- Annual tax amount: $202
Visit our professional directory to find a foreclosure specialist in your area that can help with your home search.
Find a foreclosure agentForeclosure details
Estimated market value
$259,400
$228,000 - $285,000
$1,886/mo
Price history
| Date | Event | Price |
|---|---|---|
| 1/1/1982 | Sold | $57,700$43/sqft |
Source: Agent Provided Report a problem | ||
Public tax history
| Year | Property taxes | Tax assessment |
|---|---|---|
| 2024 | $202 +3.6% | $126,860 |
| 2023 | $195 +3.7% | $126,860 +3% |
| 2022 | $188 +3.9% | $123,170 +6.1% |
| 2021 | $181 +4% | $116,110 +1.4% |
| 2020 | $174 +4.2% | $114,510 +2.3% |
| 2019 | $167 | $111,939 +21.3% |
| 2018 | $167 +4.4% | $92,265 +16.1% |
| 2017 | $160 | $79,486 +8% |
| 2016 | $160 +34.5% | $73,627 +4.3% |
| 2015 | $119 +9.2% | $70,622 +3.5% |
| 2014 | $109 | $68,221 +5.3% |
| 2013 | -- | $64,791 +0.9% |
| 2012 | -- | $64,194 -12.2% |
| 2011 | -- | $73,149 0% |
| 2010 | -- | $73,176 -19.9% |
| 2009 | -- | $91,404 -22% |
| 2008 | -- | $117,153 -8.3% |
| 2007 | -- | $127,727 +8.1% |
| 2006 | -- | $118,121 +19.4% |
| 2005 | -- | $98,910 +13.9% |
| 2004 | -- | $86,805 +18.1% |
| 2003 | -- | $73,517 +0.2% |
| 2002 | -- | $73,386 +29.5% |
| 2000 | -- | $56,665 |
| 1999 | -- | $56,665 |
Find assessor info on the county website
Monthly payment
Estimated monthly payment$1,822
All calculations are estimates and provided by Zillow, Inc. for informational purposes only. Actual amounts may vary.
HOA fees may include property taxes on listings classified as Co-Ops. Contact the listing agent and/or owner for fee details.
Mortgage interest rates are dependent on a number of factors, including credit score, down payment, and repayment length. Interest rate data provided by Zillow Group Marketplace, Inc. as of 1/1/1970 from various mortgage lenders with which we have lead or other similar arrangements; the Estimated Payment is an average of those rates.
See how much you could borrow to make a competitive offer.
Climate risks
Neighborhood: 34653
Nearby schools
GreatSchools rating
- 4/10Cotee River Elementary SchoolGrades: PK-5Distance: 0.5 mi
- 2/10Gulf Middle SchoolGrades: 6-8Distance: 1.5 mi
- 3/10Gulf High SchoolGrades: 9-12Distance: 2.2 mi


- Florida
- Pasco County
- New Port Richey
- 34653
- 7916 Lightfoot Dr
Nearby cities
Nearby neighborhoods
Nearby zip codes
Other New Port Richey Topics
