Investor special! This 3-bedroom, 1-bath 1930s bungalow in East Durham needs a full renovation — priced for the investor ready to bring it back to life. 1,030 sq ft on a 6,970 sq ft lot, minutes from Downtown Durham, Duke, and I-85. Strong rental demand and flip potential in a rapidly growing corridor. Sold as-is — bring your contractor and your vision!
For sale
$230,000
911 Holloway St, Durham, NC 27701
3beds
1,030sqft
Stick/Site Built, Residential, Single Family Residence
Built in 1930
0.16 Acres Lot
$223,700 Zestimate®
$--/sqft
$-- HOA
What's special
- 30 days
- 220
- 8
Likely to sell faster than
Zillow last checked:
Listing updated:
Listed by:
Carlos Parks 919-225-0660,
Versatile Real Estate Group
Source: Triad MLS,MLS#: 1239215
Facts & features
Interior
Bedrooms & bathrooms
- Bedrooms: 3
- Bathrooms: 1
- Full bathrooms: 1
- Main level bathrooms: 1
Heating
- Baseboard, Electric
Cooling
- None
Appliances
- Included: Electric Water Heater
Features
- Basement: Crawl Space
- Has fireplace: No
Interior area
- Total structure area: 1,030
- Total interior livable area: 1,030 sqft
- Finished area above ground: 1,030
Property
Parking
- Parking features: Driveway, Gravel
- Has uncovered spaces: Yes
Features
- Levels: One
- Stories: 1
- Pool features: None
Lot
- Size: 0.16 Acres
- Dimensions: 6970
Details
- Parcel number: 111274
- Zoning: cn
- Special conditions: Owner Sale
Construction
Type & style
- Home type: SingleFamily
- Property subtype: Stick/Site Built, Residential, Single Family Residence
Materials
- Stone, Wood Siding
Condition
- Year built: 1930
Utilities & green energy
- Sewer: Public Sewer
- Water: Public
Community & HOA
HOA
- Has HOA: No
Location
- Region: Durham
Financial & listing details
- Tax assessed value: $159,463
- Annual tax amount: $1,581
- Date on market: 10/15/2026
- Cumulative days on market: 29 days
- Listing agreement: Exclusive Right To Sell
Estimated market value
$223,700
$213,000 - $235,000
$1,827/mo
Price history
| Date | Event | Price |
|---|---|---|
| 10/29/2026 | Listed for sale | $230,000+9.6% |
Source:  Triad MLS #1239215 Report a problem | ||
| 11/24/2025 | Listing removed | $209,900$204/sqft |
Source:  Doorify MLS #10102733 Report a problem | ||
| 10/16/2025 | Price change | $209,900-2.4%$204/sqft |
Source: Doorify MLS #10102733 Report a problem | ||
| 9/24/2025 | Price change | $214,980-2.3%$209/sqft |
Source: Doorify MLS #10102733 Report a problem | ||
| 7/10/2025 | Pending sale | $220,000$214/sqft |
Source: Doorify MLS #10102733 Report a problem | ||
| 6/19/2025 | Price change | $220,000-8.3%$214/sqft |
Source: Doorify MLS #10102733 Report a problem | ||
| 6/12/2025 | Listed for sale | $240,000+60%$233/sqft |
Source: Doorify MLS #10102733 Report a problem | ||
| 9/23/2022 | Sold | $150,000+1400%$146/sqft |
Source: Public Record Report a problem | ||
| 12/11/2001 | Sold | $10,000$10/sqft |
Source: Public Record Report a problem | ||
Public tax history
| Year | Property taxes | Tax assessment |
|---|---|---|
| 2025 | $1,581 +35.3% | $159,463 +90.4% |
| 2024 | $1,168 +6.5% | $83,742 |
| 2023 | $1,097 +2.3% | $83,742 |
| 2022 | $1,072 +0.5% | $83,742 |
| 2021 | $1,067 +2.4% | $83,742 |
| 2020 | $1,042 | $83,742 |
| 2019 | $1,042 | $83,742 +43% |
| 2018 | $1,042 +32.1% | $58,565 |
| 2017 | $789 +3.5% | $58,565 |
| 2016 | $762 | $58,565 -9.1% |
| 2015 | $762 -15.7% | $64,435 -1.3% |
| 2014 | $903 | $65,258 |
| 2013 | -- | $65,258 |
| 2012 | -- | $65,258 |
| 2011 | $851 +0.4% | $65,258 |
| 2010 | $847 +4% | $65,258 |
| 2009 | $814 | $65,258 |
| 2008 | $814 +16.7% | $65,258 +32% |
| 2007 | $698 +1.4% | $49,428 |
| 2006 | $688 | $49,428 |
| 2005 | $688 +1.4% | $49,428 |
| 2004 | $679 | $49,428 |
Find assessor info on the county website
Monthly payment
Est. payment
Payment breakdown
Explore the cost of this home by adjusting the details. Changes won't be saved.Climate risks
Neighborhood: Albright


Similar homes
- $268,7002 bd2 ba1.4k sqft803 Eva St, Durham, NC 27701For Sale
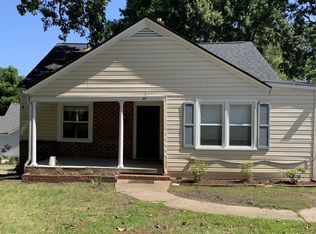
 MLS ID #10198581, Michael DePasquale. Doorify MLS
- $229,5003 bd1 ba910 sqft1302 Hearthside St, Durham, NC 27707For Sale
 MLS ID #10199393, Maggie Considine. Doorify MLS
- $260,0003 bd1 ba1.2k sqft1510 N Hyde Park Ave, Durham, NC 27701For Sale
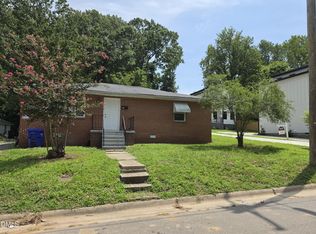 MLS ID #10189271, Chris Isaacs. Doorify MLS
- $250,0003 bd1 ba1.3k sqft612 N Queen St, Durham, NC 27701For Sale
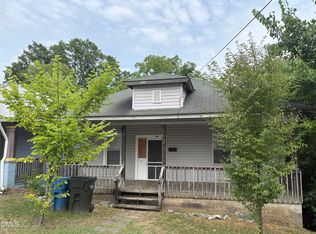 MLS ID #10178568, John Whaley. Doorify MLS
- $239,9003 bd1 ba840 sqft1405 N Hyde Park Ave, Durham, NC 27701For SaleMLS ID #10166226, Neal Barnett. Doorify MLS
- $275,0003 bd2 ba1.4k sqft431 Eugene St, Durham, NC 27701For SaleMLS ID #10194232, Marinus C Leach. Doorify MLS
- $224,0002 bd1 ba926 sqft2323 Farthing St, Durham, NC 27704For SaleMLS ID #10164413, Mary Wible. Doorify MLS
- $230,0002 bd1 ba966 sqft510 N Maple St, Durham, NC 27703For SaleMLS ID #10191217, Thomas Ladane Shoupe. Doorify MLS
- $215,0002 bd1 ba817 sqft1709 Shawnee St, Durham, NC 27701For SaleMLS ID #10178573, John Whaley. Doorify MLS
- $325,0003 bd2 ba1k sqft1105 Calvin St, Durham, NC 27701For SaleMLS ID #10183124, Lesly Areli Gomez Buenaventura. Doorify MLS
- $230,0003 bd1 ba982 sqft9 Plummer Pl, Durham, NC 27703For SaleMLS ID #10183601, Tom Bagby. Doorify MLS
- $245,0003 bd3 ba1.2k sqft404 Lynn Rd, Durham, NC 27703For SaleMLS ID #10197547, Naomi Brown-Rasmussen. Doorify MLS
- $250,0002 bd1 ba840 sqft308 E End Ave, Durham, NC 27703For SaleMLS ID #10194433, Delano Tyler. Doorify MLS
- $215,0002 bd1 ba775 sqft2412 Dallas St, Durham, NC 27707For SaleMLS ID #10189902, Germany McNeal. Doorify MLS
- $265,0003 bd3 ba1.2k sqft2029 Buffalo Way, Durham, NC 27704For SaleMLS ID #10191179, Thomas Ladane Shoupe. Doorify MLS
- $289,9993 bd2 ba987 sqft1810 Birmingham Ave, Durham, NC 27704For SaleMLS ID #10198555, Reina Colon Colon. Doorify MLS
- $277,0003 bd2 ba1.4k sqft127 Nelson St, Durham, NC 27707For SaleMLS ID #10162983, Thomas Ladane Shoupe. Doorify MLS
- $265,0004 bd2 ba1.4k sqft428 Walton St, Durham, NC 27703For SaleMLS ID #10175232, Kevin Fairfax. Doorify MLS
- $279,9004 bd3 ba1.2k sqft706 Brye St, Durham, NC 27703For SaleMLS ID #10163653, Flo Jacques. Doorify MLS
