$440,200
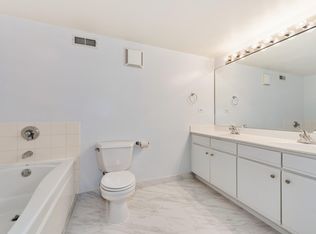
2 bd|2 ba|1.3k sqft
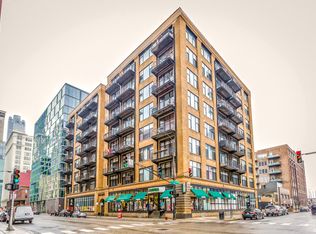
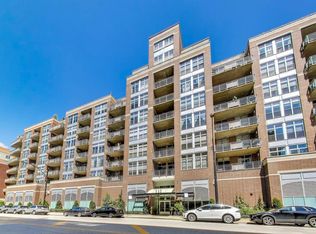
625 W Jackson Blvd APT 213, Chicago, IL 60661
Off Market
Zillow last checked:
Tom Campone 312-216-2422,
Keller Williams ONEChicago
Not available
Estimated sales range
Not available
Not available
| Date | Event | Price |
|---|---|---|
| 5/30/2025 | Listing removed | $3,500$3/sqft |
Source: Zillow Rentals Report a problem | ||
| 5/16/2025 | Listed for rent | $3,500+9.5%$3/sqft |
Source: Zillow Rentals Report a problem | ||
| 5/5/2022 | Listing removed | -- |
Source: Zillow Rental Manager Report a problem | ||
| 5/3/2022 | Listed for rent | $3,195+6.7%$2/sqft |
Source: Zillow Rental Manager Report a problem | ||
| 4/20/2021 | Listing removed | -- |
Source: Zillow Rental Manager Report a problem | ||
| 4/17/2021 | Listed for rent | $2,995$2/sqft |
Source: Zillow Rental Manager Report a problem | ||
| 7/15/2019 | Sold | $410,000+3.8%$315/sqft |
Source: | ||
| 5/21/2019 | Pending sale | $395,000$304/sqft |
Source: Redfin Corporation #10383468 Report a problem | ||
| 3/19/2019 | Listed for sale | $395,000$304/sqft |
Source: Redfin Corporation #10307999 Report a problem | ||
| 4/28/2016 | Sold | $395,000+13.7%$304/sqft |
Source: | ||
| 7/13/2007 | Sold | $347,500+21.9%$267/sqft |
Source: Public Record Report a problem | ||
| 2/25/2003 | Sold | $285,000+15.6%$219/sqft |
Source: Public Record Report a problem | ||
| 8/30/2000 | Sold | $246,500$190/sqft |
Source: Public Record Report a problem | ||
| Year | Property taxes | Tax assessment |
|---|---|---|
| 2024 | -- | $40,772 +2.1% |
| 2023 | $8,453 +2.6% | $39,926 |
| 2022 | $8,240 +2.3% | $39,926 |
| 2021 | $8,055 +11% | $39,926 +23% |
| 2020 | $7,258 +1.3% | $32,472 -8.6% |
| 2019 | $7,164 +1.7% | $35,538 |
| 2018 | $7,043 +13.2% | $35,538 +23.4% |
| 2017 | $6,219 +18.1% | $28,790 |
| 2016 | $5,266 +9.8% | $28,790 |
| 2015 | $4,795 +13.3% | $28,790 +13.5% |
| 2014 | $4,232 +2.3% | $25,376 |
| 2013 | $4,137 +0.8% | $25,376 |
| 2012 | $4,106 +4.1% | $25,376 -3.7% |
| 2011 | $3,943 -8% | $26,355 |
| 2010 | $4,289 +4.4% | $26,355 |
| 2009 | $4,110 -9.8% | $26,355 -17% |
| 2008 | $4,555 +1% | $31,753 |
| 2007 | $4,510 +12.5% | $31,753 |
| 2006 | $4,009 +8.5% | $31,753 +30% |
| 2005 | $3,694 +1.5% | $24,434 |
| 2004 | $3,638 +1.7% | $24,434 |
| 2003 | $3,577 | $24,434 |
Source: MRED as distributed by MLS GRID. This data may not be complete. We recommend contacting the local school district to confirm school assignments for this home.
A local agent can set up tours, give advice and negotiate with sellers.