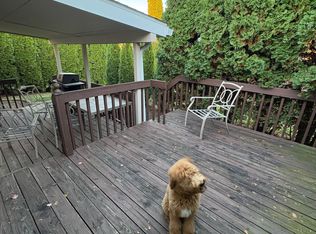
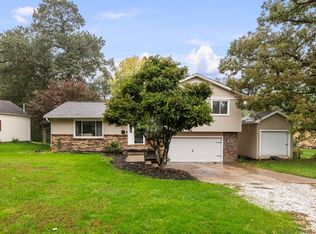
$20,727
8,398 sqft
4809 5th St, East Moline, IL 61244
Off Market
Listing description withheld by the listing agent.
Zillow last checked:
Listing updated:
Sherry Frankville 309-737-3617,
Mel Foster Co. Davenport

Not available
Estimated sales range
Not available
Not available
| Date | Event | Price |
|---|---|---|
| 11/9/2026 | Listed for sale | $285,700$173/sqft |
Source:  MRED as distributed by MLS GRID #12799454 Report a problem | ||
| Year | Property taxes | Tax assessment |
|---|---|---|
| 2025 | $7,621 +8.5% | $82,618 +8.8% |
| 2024 | $7,025 +6.7% | $75,954 +8.6% |
| 2023 | $6,586 +3.1% | $69,939 +4.2% |
| 2022 | $6,391 +2.1% | $67,120 +4.6% |
| 2021 | $6,257 +1% | $64,168 +1.7% |
| 2020 | $6,198 +1% | $63,096 +1.6% |
| 2019 | $6,139 +2.4% | $62,102 +1.5% |
| 2018 | $5,992 +3.3% | $61,168 +1.6% |
| 2017 | $5,800 +4% | $60,204 +3.2% |
| 2016 | $5,578 +3.3% | $58,337 +2.3% |
| 2015 | $5,398 +315.9% | $57,014 -1% |
| 2014 | $1,298 | $57,584 |
| 2013 | $1,298 | $57,584 -1.8% |
| 2012 | -- | $58,658 -2% |
| 2011 | -- | $59,855 |
| 2010 | -- | $59,855 +1% |
| 2008 | -- | $59,262 +2% |
| 2006 | -- | $58,100 +5.6% |
| 2005 | $4,615 +3.6% | $55,032 +3% |
| 2004 | $4,453 +3.6% | $53,429 +3% |
| 2003 | $4,297 +5% | $51,873 +4% |
| 2002 | $4,093 +4.4% | $49,878 +3.5% |
| 2001 | $3,922 0% | $48,191 -1.3% |
| 2000 | $3,922 | $48,826 |
Source: MRED as distributed by MLS GRID. This data may not be complete. We recommend contacting the local school district to confirm school assignments for this home.


A local agent can set up tours, give advice and negotiate with sellers.
A local lender can help you make sure your offer is ready when you are.