$470,700
3 bd|3 ba|-- sqft
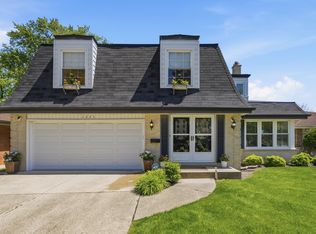
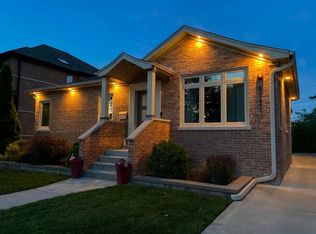
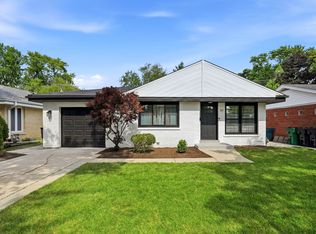
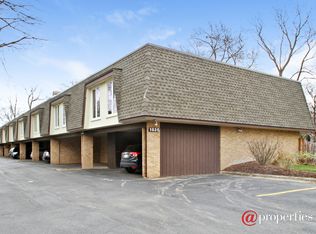
1835 Tanglewood Dr UNIT B, Glenview, IL 60025
Off Market
Zillow last checked:
Listing updated:
Antonio Bavaro antoniobavaro40@gmail.com,
Fulton Grace Realty
Not available
Estimated sales range
Not available
Not available
| Date | Event | Price |
|---|---|---|
| 6/22/2026 | Listed for sale | $750,000+0.1%$268/sqft |
Source: MRED as distributed by MLS GRID #12679056 Report a problem | ||
| 6/12/2026 | Listing removed | $749,000$267/sqft |
Source: MRED as distributed by MLS GRID #12612502 Report a problem | ||
| 5/10/2026 | Contingent | $749,000$267/sqft |
Source: | ||
| 4/7/2026 | Price change | $749,000-6.4%$267/sqft |
Source: | ||
| 3/10/2026 | Price change | $799,900-9.1%$285/sqft |
Source: | ||
| 1/22/2026 | Listed for sale | $879,990+214.3%$314/sqft |
Source: | ||
| 8/12/2025 | Sold | $280,000-20%$100/sqft |
Source: | ||
| 5/27/2025 | Contingent | $350,000$125/sqft |
Source: | ||
| 5/14/2025 | Listed for sale | $350,000-11.4%$125/sqft |
Source: | ||
| 5/8/2025 | Contingent | $395,000$141/sqft |
Source: | ||
| 4/15/2025 | Price change | $395,000-20.2%$141/sqft |
Source: | ||
| 4/2/2025 | Listed for sale | $495,000$177/sqft |
Source: | ||
| Year | Property taxes | Tax assessment |
|---|---|---|
| 2024 | -- | $36,000 |
| 2023 | $6,647 +3.6% | $36,000 |
| 2022 | $6,419 +10.9% | $36,000 +20.3% |
| 2021 | $5,790 +8.5% | $29,923 |
| 2020 | $5,335 +6.7% | $29,923 -10% |
| 2019 | $5,001 -28% | $33,248 +10.1% |
| 2018 | $6,946 +28.6% | $30,202 |
| 2017 | $5,401 -15.5% | $30,202 |
| 2016 | $6,389 +2.1% | $30,202 -1.8% |
| 2015 | $6,256 -13% | $30,766 |
| 2014 | $7,192 +3.1% | $30,766 |
| 2013 | $6,973 -3.8% | $30,766 -11.7% |
| 2012 | $7,246 +4.7% | $34,835 |
| 2011 | $6,918 +2.2% | $34,835 |
| 2010 | $6,771 +1.3% | $34,835 -22% |
| 2009 | $6,687 +77.9% | $44,685 -7% |
| 2008 | $3,759 +4.3% | $48,048 |
| 2007 | $3,605 -17.7% | $48,048 +42.9% |
| 2006 | $4,382 -1.2% | $33,622 |
| 2005 | $4,435 +4.6% | $33,622 |
| 2004 | $4,238 +13.8% | $33,622 +44.7% |
| 2003 | $3,724 +0.8% | $23,242 |
| 2002 | $3,695 +44.7% | $23,242 |
| 2001 | $2,554 -0.5% | $23,242 +45.4% |
| 2000 | $2,568 +1.2% | $15,987 |
| 1999 | $2,537 | $15,987 |
Source: MRED as distributed by MLS GRID. This data may not be complete. We recommend contacting the local school district to confirm school assignments for this home.
A local agent can set up tours, give advice and negotiate with sellers.
A local lender can help you make sure your offer is ready when you are.