$494,300
3 bd|3 ba|1.2k sqft
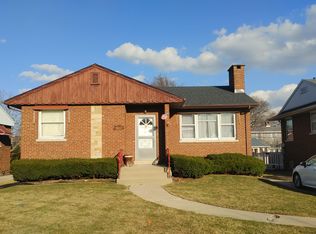
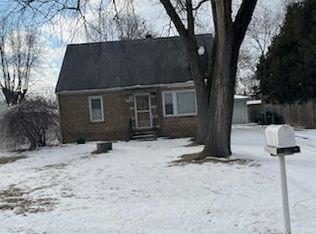
824 East Ave, La Grange, IL 60525
Off Market

Zillow last checked:
Listing updated:
Luis O Rojas 773-502-5400,
Turn Key Realty Solutions
$300,800
$286,000 - $316,000
$2,339/mo
| Date | Event | Price |
|---|---|---|
| 3/2/2026 | Listed for sale | $314,900+26%$339/sqft |
Source: | ||
| 2/24/2022 | Listing removed | -- |
Source: | ||
| 2/11/2022 | Listed for sale | $249,8730%$269/sqft |
Source: | ||
| 2/3/2022 | Listing removed | -- |
Source: | ||
| 11/10/2021 | Price change | $249,900-2%$269/sqft |
Source: | ||
| 11/8/2021 | Price change | $254,900-1.9%$274/sqft |
Source: | ||
| 10/23/2021 | Listed for sale | $259,900-3.7%$279/sqft |
Source: | ||
| 10/23/2021 | Listing removed | -- |
Source: | ||
| 10/16/2021 | Price change | $269,900-3.6%$290/sqft |
Source: | ||
| 10/6/2021 | Price change | $279,900-3.4%$301/sqft |
Source: | ||
| 9/17/2021 | Listed for sale | $289,900+93.3%$312/sqft |
Source: | ||
| 12/10/2012 | Sold | $150,000-3.2%$161/sqft |
Source: | ||
| 9/18/2012 | Price change | $154,900-6.1%$167/sqft |
Source: Coldwell Banker Residential Brokerage - Schaumburg #08096555 Report a problem | ||
| 8/5/2012 | Price change | $164,900-2.9%$177/sqft |
Source: Coldwell Banker Residential Brokerage - Schaumburg #08096555 Report a problem | ||
| 6/22/2012 | Listed for sale | $169,900+19.6%$183/sqft |
Source: Coldwell Banker Residential Brokerage - Schaumburg #08096555 Report a problem | ||
| 11/16/2000 | Sold | $142,000$153/sqft |
Source: Public Record Report a problem | ||
| Year | Property taxes | Tax assessment |
|---|---|---|
| 2024 | -- | $28,001 +0% |
| 2023 | $5,915 +35.9% | $27,999 +49.6% |
| 2022 | $4,353 +3.5% | $18,713 |
| 2021 | $4,205 +1.7% | $18,713 |
| 2020 | $4,134 -0.3% | $18,713 -1.1% |
| 2019 | $4,147 +1.3% | $18,927 |
| 2018 | $4,094 +2.5% | $18,927 |
| 2017 | $3,992 -3.9% | $18,927 +8.4% |
| 2016 | $4,153 +2.3% | $17,467 |
| 2015 | $4,059 +16% | $17,467 |
| 2014 | $3,499 -20.1% | $17,467 -10.3% |
| 2013 | $4,381 +2.8% | $19,483 |
| 2012 | $4,262 -9.3% | $19,483 |
| 2011 | $4,701 +0.7% | $19,483 -31.3% |
| 2010 | $4,667 +10.2% | $28,361 |
| 2009 | $4,234 +25.8% | $28,361 -7% |
| 2008 | $3,366 -2.2% | $30,496 +18% |
| 2007 | $3,441 +4.4% | $25,838 |
| 2006 | $3,296 +1.9% | $25,838 |
| 2005 | $3,234 +2.6% | $25,838 +44.2% |
| 2004 | $3,151 +8.7% | $17,920 |
| 2003 | $2,899 +3.4% | $17,920 |
| 2002 | $2,805 +24.5% | $17,920 +29.4% |
| 2001 | $2,254 +4.7% | $13,850 |
| 2000 | $2,152 +16.1% | $13,850 |
| 1999 | $1,854 | $13,850 |
Source: MRED as distributed by MLS GRID. This data may not be complete. We recommend contacting the local school district to confirm school assignments for this home.
A local agent can set up tours, give advice and negotiate with sellers.