$255,600
3 bd|1 ba|1.5k sqft
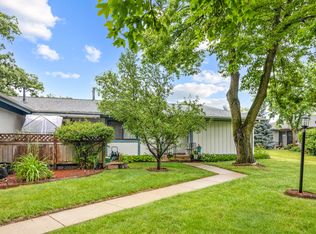
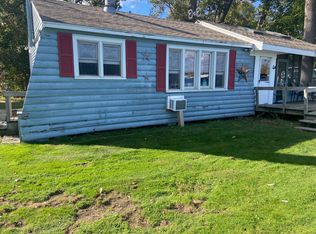
4907 Fountain Ln, Mccullom Lake, IL 60050
Off Market
Likely to sell faster than
Zillow last checked:
Frank Capasso (847)778-7301,
eXp Realty
Not available
Estimated sales range
Not available
Not available
| Date | Event | Price |
|---|---|---|
| 6/15/2026 | Contingent | $169,900$190/sqft |
Source: eXp Realty #12670621 Report a problem | ||
| 6/7/2026 | Listed for sale | $169,900-2.9%$190/sqft |
Source: eXp Realty #12670621 Report a problem | ||
| 6/7/2026 | Listing removed | $174,900$195/sqft |
Source: eXp Realty #12630801 Report a problem | ||
| 4/29/2026 | Listed for sale | $174,900+14.3%$195/sqft |
Source: | ||
| 2/7/2025 | Sold | $153,000-2.5%$171/sqft |
Source: | ||
| 1/15/2025 | Contingent | $157,000$175/sqft |
Source: | ||
| 12/6/2024 | Listed for sale | $157,000+946.7%$175/sqft |
Source: | ||
| 3/24/2021 | Listing removed | -- |
Source: Owner Report a problem | ||
| 6/14/2017 | Listing removed | $895$1/sqft |
Source: Owner Report a problem | ||
| 5/20/2017 | Listed for rent | $895$1/sqft |
Source: Owner Report a problem | ||
| 2/17/2010 | Sold | $15,000-42.1%$17/sqft |
Source: Public Record Report a problem | ||
| 10/17/2009 | Price change | $25,900-13.4%$29/sqft |
Source: foreclosure.com Report a problem | ||
| 9/12/2009 | Price change | $29,900-10.2%$33/sqft |
Source: foreclosure.com Report a problem | ||
| 8/9/2009 | Listed for sale | $33,300-66.8%$37/sqft |
Source: foreclosure.com Report a problem | ||
| 10/19/2004 | Sold | $100,200+72.8%$112/sqft |
Source: Public Record Report a problem | ||
| 2/20/2002 | Sold | $58,000+38.1%$65/sqft |
Source: Public Record Report a problem | ||
| 3/2/1994 | Sold | $42,000$47/sqft |
Source: Public Record Report a problem | ||
| Year | Property taxes | Tax assessment |
|---|---|---|
| 2024 | $3,739 +2.4% | $45,146 +11.6% |
| 2023 | $3,652 +18.3% | $40,446 +21.3% |
| 2022 | $3,087 +4.5% | $33,340 +7.4% |
| 2021 | $2,952 +137.3% | $31,048 +160.2% |
| 2020 | $1,244 | $11,932 +5.3% |
| 2019 | -- | $11,331 +20.5% |
| 2018 | $1,108 +3.5% | $9,406 +6.5% |
| 2017 | $1,070 +105.1% | $8,828 +7% |
| 2016 | $522 | $8,250 -31% |
| 2013 | $522 | $11,954 +139.1% |
| 2011 | -- | $5,000 -82% |
| 2010 | -- | $27,709 -7.2% |
| 2009 | -- | $29,853 -1.4% |
| 2008 | -- | $30,284 +43.5% |
| 2006 | -- | $21,102 +8.4% |
| 2005 | $1,057 +11.6% | $19,461 +6.9% |
| 2004 | $947 -7.4% | $18,211 +3.8% |
| 2003 | $1,022 +1.7% | $17,549 +4.8% |
| 2002 | $1,005 +16.7% | $16,749 +4.1% |
| 2001 | $861 +1.8% | $16,094 +3.4% |
| 2000 | $846 | $15,563 |
Source: MRED as distributed by MLS GRID. This data may not be complete. We recommend contacting the local school district to confirm school assignments for this home.
A local agent can set up tours, give advice and negotiate with sellers.