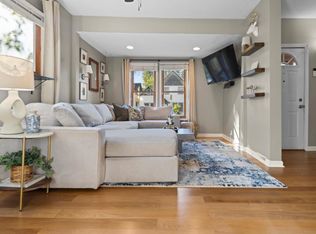
Investor opportunity! This 4-bedroom, 2-bathroom house is already leased through August 25, 2027, providing immediate rental income. Ideally located near the University of Minnesota, this property is well positioned for consistent tenant demand. Seller owns additional investment properties. Buyers interested in acquiring more properties may contact agent for more information.
Active
$319,000
1096 23rd Ave SE, Minneapolis, MN 55414
4beds
1,311sqft
Single Family
Built in 1927
5,227 Square Feet Lot
$314,300 Zestimate®
$243/sqft
$-- HOA
What's special
- 20 days
- 251
- 33
Zillow last checked:
Listing updated:
Listed by:
Melissa M Genereux 612-220-3196,
Gener8 Group LLC
Source: NorthstarMLS as distributed by MLS GRID,MLS#: 7066899
Facts & features
Interior
Bedrooms & bathrooms
- Bedrooms: 4
- Bathrooms: 2
- 3/4 bathrooms: 2
Heating
- Forced Air
Cooling
- Central Air
Features
- Basement: Egress Window(s),Partially Finished,Storage Space
- Has fireplace: No
Interior area
- Total structure area: 1,761
- Total interior livable area: 1,311 sqft
- Finished area above ground: 1,101
- Finished area below ground: 210
Property
Parking
- Total spaces: 1
- Parking features: Detached Garage
- Garage spaces: 1
Accessibility
- Accessibility features: None
Features
- Levels: One and One Half
- Stories: 1.5
Lot
- Size: 5,227 Square Feet
- Dimensions: 40 x 128
Details
- Foundation area: 660
- Parcel number: 1902923210082
- Zoning description: Residential-Single Family
Construction
Type & style
- Home type: SingleFamily
- Property subtype: Single Family
Condition
- New construction: No
- Year built: 1927
Utilities & green energy
- Gas: Natural Gas
- Sewer: City Sewer/Connected
- Water: City Water/Connected
Community & HOA
Community
- Subdivision: Glencar Add
HOA
- Has HOA: No
Location
- Region: Minneapolis
Financial & listing details
- Price per square foot: $243/sqft
- Tax assessed value: $249,100
- Annual tax amount: $3,757
- Date on market: 9/30/2026
- Cumulative days on market: 123 days
Estimated market value
$314,300
$299,000 - $330,000
$2,372/mo
Price history
| Date | Event | Price |
|---|---|---|
| 9/30/2026 | Listed for sale | $319,000$243/sqft |
Source:  NorthstarMLS as distributed by MLS GRID #7066899 Report a problem | ||
| 8/18/2026 | Listing removed | $319,000$243/sqft |
Source: NorthstarMLS as distributed by MLS GRID #7066899 Report a problem | ||
| 5/7/2026 | Listed for sale | $319,000+59.5%$243/sqft |
Source: NorthstarMLS as distributed by MLS GRID #7066899 Report a problem | ||
| 10/24/2023 | Listing removed | -- |
Source: Zillow Rentals Report a problem | ||
| 10/22/2023 | Listed for rent | $2,060+3%$2/sqft |
Source: Zillow Rentals Report a problem | ||
| 11/21/2022 | Listing removed | -- |
Source: Zillow Rental Manager Report a problem | ||
| 11/19/2022 | Price change | $2,000-4.8%$2/sqft |
Source: Zillow Rental Manager Report a problem | ||
| 10/21/2022 | Listed for rent | $2,100$2/sqft |
Source: Zillow Rental Manager Report a problem | ||
| 10/14/2022 | Listing removed | -- |
Source: Zillow Rental Manager Report a problem | ||
| 10/12/2022 | Listed for rent | $2,100+5%$2/sqft |
Source: Zillow Rental Manager Report a problem | ||
| 6/7/2022 | Listing removed | -- |
Source: Zillow Rental Manager Report a problem | ||
| 10/28/2021 | Listed for rent | $2,000-20%$2/sqft |
Source: Zillow Rental Manager Report a problem | ||
| 6/14/2021 | Listing removed | -- |
Source: Zillow Rental Manager Report a problem | ||
| 2/3/2021 | Listed for rent | $2,500+79.2%$2/sqft |
Source: Zillow Rental Manager Report a problem | ||
| 1/13/2021 | Sold | $200,000+2.6%$153/sqft |
Source: NorthstarMLS as distributed by MLS GRID #5673945 Report a problem | ||
| 9/1/2018 | Listing removed | $1,395$1/sqft |
Source: RP Management, Inc. CRMC Report a problem | ||
| 8/16/2018 | Listed for rent | $1,395$1/sqft |
Source: RP Management, Inc. CRMC Report a problem | ||
| 1/16/2010 | Listing removed | $195,000$149/sqft |
Source: RE/MAX Results Inc #3840848 Report a problem | ||
| 9/30/2009 | Listed for sale | $195,000+2.3%$149/sqft |
Source: RE/MAX Results Inc #3840848 Report a problem | ||
| 2/24/2005 | Sold | $190,600+90.6%$145/sqft |
Source: Public Record Report a problem | ||
| 7/9/1999 | Sold | $100,000$76/sqft |
Source: Public Record Report a problem | ||
Public tax history
| Year | Property taxes | Tax assessment |
|---|---|---|
| 2026 | $3,757 +9.4% | $249,100 +2.6% |
| 2025 | $3,436 +6.6% | $242,700 +5.1% |
| 2024 | $3,224 +0.4% | $231,000 -6.5% |
| 2023 | $3,210 +7.7% | $247,000 +1.2% |
| 2022 | $2,980 +3.9% | $244,000 +13.5% |
| 2021 | $2,869 -7.7% | $215,000 +0.2% |
| 2020 | $3,109 +8.4% | $214,500 |
| 2019 | $2,869 -7.7% | $214,500 +5.9% |
| 2018 | $3,109 +14.3% | $202,500 +18.4% |
| 2017 | $2,719 +3.3% | $171,000 +9.3% |
| 2016 | $2,633 +5.8% | $156,500 |
| 2015 | $2,489 -4.8% | $156,500 +5% |
| 2014 | $2,613 +2.2% | $149,000 +4.9% |
| 2013 | $2,557 +0.1% | $142,000 -2.4% |
| 2012 | $2,553 -3.5% | $145,500 -7.9% |
| 2011 | $2,645 +14.6% | $158,000 |
| 2010 | $2,308 -11% | $158,000 -9.9% |
| 2009 | $2,593 +38.3% | $175,300 +18.1% |
| 2006 | $1,875 -11.5% | $148,400 +14.9% |
| 2005 | $2,119 +15.6% | $129,100 +15% |
| 2004 | $1,833 +9.9% | $112,300 +12% |
| 2002 | $1,667 -39.5% | $100,300 |
| 2001 | $2,754 | -- |
Find assessor info on the county website
Monthly payment
Est. payment
Payment breakdown
Explore the cost of this home by adjusting the details. Changes won't be saved.Climate risks
Neighborhood: Southeast Como
Similar homes
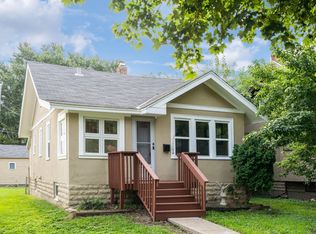
- $300,0002 bd2 ba1.2k sqft2941 44th Ave S, Minneapolis, MN 55406For Sale
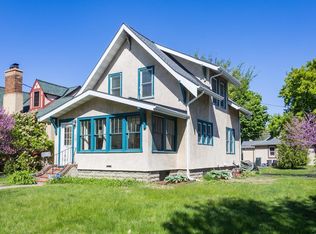
 MLS ID #7084362, Annadee Marie Aanden, Keller Williams Realty Integrity Lakes. NorthstarMLS as distributed by MLS GRID
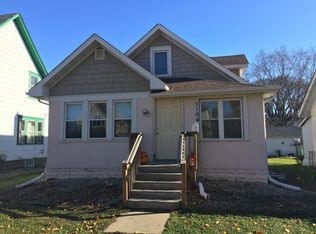
- $325,0003 bd2 ba1.5k sqft4840 N 6th St, Minneapolis, MN 55430For Sale
 MLS ID #7156547, Jennifer Fisk-Madison, eXp Realty. NorthstarMLS as distributed by MLS GRID
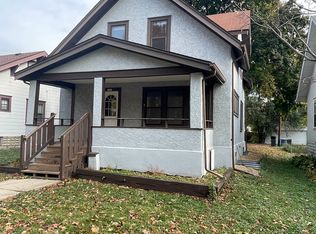
- $340,0003 bd2 ba1.8k sqft3905 Cedar Ave S, Minneapolis, MN 55407For Sale
 MLS ID #7152880, Janette Liddle, Keller Williams Classic Realty. NorthstarMLS as distributed by MLS GRID
- $309,9003 bd2 ba1.1k sqft3812 13th Ave S, Minneapolis, MN 55407For Sale
 MLS ID #7121196, Caleb Carlson, Real Broker, LLC. NorthstarMLS as distributed by MLS GRID
- $370,0003 bd2 ba1.2k sqft2523 Arthur St NE, Minneapolis, MN 55418For SaleMLS ID #7138540, Frances Hoekstra Bakke, Coldwell Banker Realty - Southwest Regional. NorthstarMLS as distributed by MLS GRID
- $299,0004 bd2 ba1.6k sqft1291 Sherburne Ave, Saint Paul, MN 55104For SaleMLS ID #7137122, Greg Granlund, Edina Realty, Inc.. NorthstarMLS as distributed by MLS GRID
- $289,9004 bd3 ba1.2k sqft3810 Thomas Ave N, Minneapolis, MN 55412For SaleMLS ID #7087867, Joe Mueller, RE/MAX Results. NorthstarMLS as distributed by MLS GRID
- $299,5003 bd1 ba1.6k sqft4242 Thomas Ave N, Minneapolis, MN 55412For SaleMLS ID #7131886, Justin J. Schwartz, Ashworth Real Estate. NorthstarMLS as distributed by MLS GRID
- $300,0002 bd1 ba898 sqft3112 E 33rd St, Minneapolis, MN 55406For SaleMLS ID #7155164, Steve Smillie, Edina Realty, Inc.. NorthstarMLS as distributed by MLS GRID
- $284,9994 bd2 ba1.3k sqft1825 Minnehaha Ave W, Saint Paul, MN 55104For SaleMLS ID #7134935, Ryan M Platzke, Coldwell Banker Realty - Southwest Regional. NorthstarMLS as distributed by MLS GRID
- $324,9002 bd1 ba968 sqft1586 Grotto St N, Saint Paul, MN 55117For SaleMLS ID #7060836, Shawn D. Korby, Keller Williams Integrity Realty. NorthstarMLS as distributed by MLS GRID
- $299,0003 bd1 ba1.5k sqft3616 Pillsbury Ave S, Minneapolis, MN 55409For SaleMLS ID #7147474, Christine K Smith, Engel & Volkers Lake Minnetonka. NorthstarMLS as distributed by MLS GRID
- $314,9003 bd2 ba1.3k sqft420 Daly St, Saint Paul, MN 55102For SaleMLS ID #7153626, Thomas Edelstein, CRS, ABR, Coldwell Banker Realty. NorthstarMLS as distributed by MLS GRID
- $305,0004 bd2 ba1.7k sqft2915 N 3rd St, Minneapolis, MN 55411For SaleMLS ID #7080138, Hosie, Keller Williams Realty Integrity Lakes. NorthstarMLS as distributed by MLS GRID
- $299,9004 bd2 ba1.5k sqft3745 Orchard Ave N, Robbinsdale, MN 55422For SaleMLS ID #7098617, Derek Eley, Mitchell Realty LLC. NorthstarMLS as distributed by MLS GRID
- $349,0004 bd2 ba1.8k sqft1595 Maywood St, Saint Paul, MN 55117For SaleMLS ID #7128101, Cheryl J. Larson, eXp Realty. NorthstarMLS as distributed by MLS GRID
- $329,9003 bd1 ba1.1k sqft6810 W 23rd St, Saint Louis Park, MN 55426For SaleMLS ID #7112853, Christian K Lindgren, Keller Williams Realty Integrity Lakes. NorthstarMLS as distributed by MLS GRID
- $284,9003 bd1 ba1.6k sqft1714 Hewitt Ave, Saint Paul, MN 55104For SaleMLS ID #7107747, Shane M. Montoya, Coldwell Banker Realty. NorthstarMLS as distributed by MLS GRID
- $323,0003 bd2 ba1.5k sqft1735 Birch Lake Ave, White Bear Lake, MN 55110For SaleMLS ID #7151735, Paige C Tollefsbol, RE/MAX Results. NorthstarMLS as distributed by MLS GRID
