THIS IS A 4 PROPERTY PORTFOLIO AND MUST BE SOLD AS ONE. WILL NOT BE SOLD INDIVIDUALLY! 108-114 3RD ST & 507-513 W HURON ST, ANN ARBOR, MI 48103
Active
$2,200,000
114 3rd St, Ann Arbor, MI 48103
3beds
2baths
--sqft
2 to 4 Units
Built in 1901
-- sqft lot
$-- Zestimate®
$--/sqft
$-- HOA
What's special
- 20 days
- 219
- 6
Zillow last checked:
Listing updated:
Listed by:
George Abro 248-404-7281,
Altitude Commercial Real Estat 248-781-8077
Source: MichRIC,MLS#: 26052566
Facts & features
Interior
Bedrooms & bathrooms
- Bedrooms: 3
- Bathrooms: 2
Heating
- Forced Air
Features
- Basement: Crawl Space,Michigan Basement
Property
Lot
- Size: 6,534 Square Feet
- Dimensions: 47 x 134
Details
- Parcel number: 090929208025
Construction
Type & style
- Home type: MultiFamily
- Property subtype: 2 to 4 Units
Materials
- Vinyl Siding
Condition
- New construction: No
- Year built: 1901
Utilities & green energy
- Sewer: Public Sewer
- Utilities for property: Natural Gas Connected, Electricity Connected
Community & HOA
Location
- Region: Ann Arbor
Financial & listing details
- Tax assessed value: $81,016
- Annual tax amount: $5,509
- Date on market: 10/2/2026
- Listing terms: FHA,Cash,Conventional
- Tenant pays: Electricity, Water
- Electric utility on property: Yes
Estimated market value
Not available
Estimated sales range
Not available
$2,158/mo
Price history
| Date | Event | Price |
|---|---|---|
| 10/2/2026 | Listed for sale | $2,200,000+3549% |
Source:  MichRIC #26052566 Report a problem | ||
| 1/24/2013 | Sold | $60,290 |
Source: Agent Provided Report a problem | ||
Public tax history
| Year | Property taxes | Tax assessment |
|---|---|---|
| 2026 | $5,468 +2.9% | $206,700 +5.2% |
| 2025 | $5,316 | $196,500 +10.6% |
| 2024 | -- | $177,700 +7% |
| 2023 | -- | $166,000 +2.2% |
| 2022 | -- | $162,500 +1.9% |
| 2021 | -- | $159,400 -7.4% |
| 2020 | $4,335 | $172,200 +0.5% |
| 2019 | -- | $171,400 +3.8% |
| 2018 | -- | $165,200 +18.1% |
| 2017 | $3,814 | $139,900 +127% |
| 2016 | $3,814 +4.3% | $61,640 +0.3% |
| 2015 | $3,657 | $61,456 +3.2% |
| 2014 | $3,657 | $59,537 |
| 2013 | $3,657 | $59,537 +2.4% |
| 2012 | -- | $58,142 -45.9% |
| 2011 | -- | $107,500 +93.1% |
| 2010 | -- | $55,668 -0.3% |
| 2009 | -- | $55,836 +4.4% |
| 2008 | -- | $53,483 +2.3% |
| 2007 | -- | $52,281 -57.6% |
| 2005 | -- | $123,400 +12.1% |
| 2004 | -- | $110,100 +13.4% |
| 2003 | -- | $97,100 +55.1% |
| 2002 | $2,571 +51.3% | $62,600 +7.6% |
| 2001 | $1,699 +2.3% | $58,200 +11.7% |
| 2000 | $1,660 | $52,100 +21.7% |
| 1999 | -- | $42,800 |
Find assessor info on the county website
Monthly payment
Est. payment
Payment breakdown
Explore the cost of this home by adjusting the details. Changes won't be saved.Climate risks
Neighborhood: Old West Side


Similar homes
- $2,200,0003 bd2 ba-- sqft108 3rd St, Ann Arbor, MI 48103For Sale

 MLS ID #26052558, George Abro, Altitude Commercial Real Estat. MichRIC
- $2,200,0006 bd5 ba-- sqft513 W Huron St, Ann Arbor, MI 48103For Sale
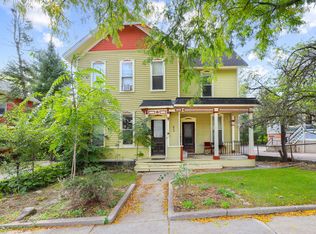 MLS ID #26052574, George Abro, Altitude Commercial Real Estat. MichRIC
- $2,200,0006 bd4 ba-- sqft507 W Huron St, Ann Arbor, MI 48103For Sale
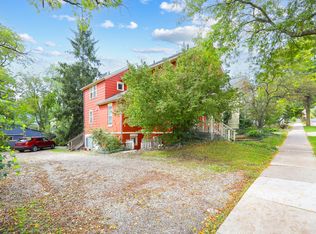 MLS ID #26052571, George Abro, Altitude Commercial Real Estat. MichRIC
- $1,995,0005 bd6 ba2.8k sqft901 5th St, Ann Arbor, MI 48103For Sale
 MLS ID #26013364, Matthew Dejanovich, Real Estate One Inc. MichRIC
- $1,775,0004 bd4 ba4.7k sqft445 Huntington Dr, Ann Arbor, MI 48104For SaleMLS ID #26056317, Nancy Bishop, The Charles Reinhart Company. MichRIC
- $2,150,0004 bd4 ba5.1k sqft1030 Spruce Dr, Ann Arbor, MI 48104For SaleMLS ID #26048206, Melissa VanDam, The Charles Reinhart Company. MichRIC
- $1,100,0005 bd6 ba-- sqft1310 Packard St, Ann Arbor, MI 48104For SaleMLS ID #26042445, Jonathon Keller, J Keller Properties, LLC. MichRIC
- $2,400,0004 bd6 ba9.2k sqft161 Laurin Ct, Ann Arbor, MI 48105For SaleMLS ID #26053832, Sara Maddock, @properties Christie's Int'lAA. MichRIC
- $1,899,0004 bd3 ba4k sqft1158 Baldwin Ave, Ann Arbor, MI 48104For SaleMLS ID #26048941, Christopher Brady, The Charles Reinhart Company. MichRIC
- $1,475,0004 bd6 ba8k sqft2086 Autumn Hill Dr, Ann Arbor, MI 48103For SaleMLS ID #26042857, Nancy Bishop, The Charles Reinhart Company. MichRIC
- $1,749,0004 bd3 ba3.2k sqft596 S Parker Rd, Ann Arbor, MI 48103For SaleMLS ID #26034244, Laura Fisher, Cornerstone Real Estate. MichRIC
- $2,895,0003 bd4 ba3.1k sqft544 Detroit St #201, Ann Arbor, MI 48104For SaleMLS ID #26047258, Gina Walsh, The Charles Reinhart Company. MichRIC
- $1,125,0004 bd4 ba2.9k sqft857 Wildt St, Ann Arbor, MI 48103For SaleMLS ID #26031495, Kevin Daum, Keller Williams Ann Arbor Mrkt. MichRIC
- $1,300,0005 bd5 ba4.4k sqft887 Gallery Ln, Ann Arbor, MI 48103For SaleMLS ID #26052685, Nancy Bishop, The Charles Reinhart Company. MichRIC
- $1,875,0003 bd4 ba2.4k sqft530 N Division St, Ann Arbor, MI 48104New ConstructionMLS ID #26040318, Carson Alexander-White, Bob White Realty. MichRIC
- $1,495,0004 bd4 ba3.8k sqft916 Olivia Ave, Ann Arbor, MI 48104For SaleMLS ID #26044879, Jean Wedemeyer, The Charles Reinhart Company. MichRIC
- $2,500,0006 bd8 ba8k sqft4911 Red Fox Run, Ann Arbor, MI 48105For SaleMLS ID #26037947, Matthew Dejanovich, Real Estate One Inc. MichRIC
- $1,275,0004 bd4 ba3.8k sqft355 Koch Ave, Ann Arbor, MI 48103For SaleMLS ID #26022633, Matthew Miller, The Charles Reinhart Company. MichRIC
- $1,650,0005 bd5 ba5.2k sqft521 Rock Creek Dr, Ann Arbor, MI 48104For SaleMLS ID #26048243, Nancy Bishop, The Charles Reinhart Company. MichRIC
- $2,347,1155 bd4 ba4.5k sqft244 Barton Shore Dr #1, Ann Arbor, MI 48105New ConstructionMLS ID #26028323, Jade Mazzola, Berkshire Hathaway Snyder & Co. MichRIC
