$190,200
1 bd|1 ba|650 sqft
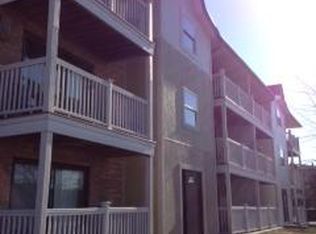
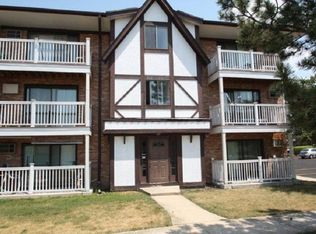
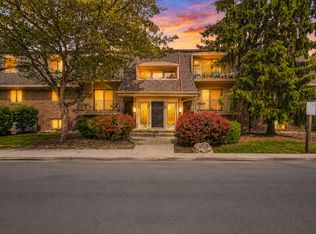
301 Gregory St APT 1, Aurora, IL 60504
Off Market
Zillow last checked:
Ioannis Karnavas 312-478-2650,
@properties Christies International Real Estate
Not available
Estimated sales range
Not available
Not available
| Date | Event | Price |
|---|---|---|
| 6/21/2026 | Pending sale | $179,999$202/sqft |
Source: | ||
| 6/19/2026 | Listed for sale | $179,999+38.5%$202/sqft |
Source: | ||
| 12/14/2022 | Sold | $130,000-3.7%$146/sqft |
Source: | ||
| 11/17/2022 | Contingent | $135,000$152/sqft |
Source: | ||
| 11/9/2022 | Listed for sale | $135,000-2.9%$152/sqft |
Source: | ||
| 11/9/2022 | Listing removed | -- |
Source: | ||
| 10/17/2022 | Listed for sale | $139,000+167.3%$156/sqft |
Source: | ||
| 7/25/2016 | Sold | $52,000$58/sqft |
Source: Public Record Report a problem | ||
| 1/29/2016 | Sold | $52,000-5.3%$58/sqft |
Source: | ||
| 10/29/2015 | Listed for sale | $54,900-35.4%$62/sqft |
Source: RE/MAX Professionals Select #09075032 Report a problem | ||
| 9/9/2003 | Sold | $85,000+18.1%$96/sqft |
Source: Public Record Report a problem | ||
| 1/15/2002 | Sold | $72,000+25.2%$81/sqft |
Source: Public Record Report a problem | ||
| 4/17/2000 | Sold | $57,500$65/sqft |
Source: Public Record Report a problem | ||
| Year | Property taxes | Tax assessment |
|---|---|---|
| 2024 | $2,662 +4.1% | $35,012 +11.3% |
| 2023 | $2,557 +9.7% | $31,460 +13.2% |
| 2022 | $2,330 +2.5% | $27,780 +3.7% |
| 2021 | $2,273 -1.2% | $26,790 |
| 2020 | $2,300 +3.3% | $26,790 +5.1% |
| 2019 | $2,226 +25.8% | $25,480 +27.1% |
| 2018 | $1,770 +8.1% | $20,040 +10.2% |
| 2017 | $1,638 +69.4% | $18,180 +10.4% |
| 2016 | $967 +3.8% | $16,460 +5.3% |
| 2015 | $932 +14.4% | $15,630 +10.2% |
| 2014 | $815 +0.6% | $14,180 -0.7% |
| 2013 | $810 -52.3% | $14,280 -41.2% |
| 2012 | $1,699 +0.8% | $24,290 -6.4% |
| 2011 | $1,685 -21.6% | $25,960 -21.3% |
| 2010 | $2,150 +2.4% | $33,000 -4% |
| 2009 | $2,099 +2% | $34,370 +1.8% |
| 2008 | $2,059 +3.9% | $33,760 +5.8% |
| 2007 | $1,983 +10.4% | $31,910 +10.8% |
| 2006 | $1,796 +7.5% | $28,790 +8.8% |
| 2005 | $1,671 +11.4% | $26,470 +9% |
| 2004 | $1,500 -1.6% | $24,280 +6.8% |
| 2003 | $1,524 +7.7% | $22,740 +6.1% |
| 2002 | $1,416 +5.1% | $21,440 +4.7% |
| 2001 | $1,347 -12.6% | $20,470 +4.4% |
| 2000 | $1,541 | $19,600 |
Find assessor info on the county website
Source: MRED as distributed by MLS GRID. This data may not be complete. We recommend contacting the local school district to confirm school assignments for this home.
A local agent can set up tours, give advice and negotiate with sellers.
A local lender can help you make sure your offer is ready when you are.