$18,993
-- bd|-- ba|-- sqft
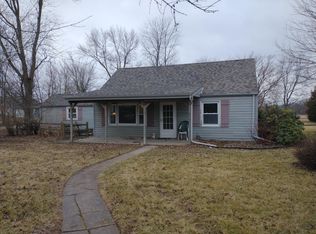
1220 Dixie Hwy, Beecher, IL 60401
Off Market
Zillow last checked:
Listing updated:
Karin Gustafson 708-663-2083,
Advanced Real Estate LLC
Not available
Estimated sales range
Not available
Not available
| Date | Event | Price |
|---|---|---|
| 6/6/2026 | Pending sale | $399,900$240/sqft |
Source: | ||
| 4/24/2026 | Listed for sale | $399,900+60%$240/sqft |
Source: | ||
| 4/11/2017 | Listing removed | $250,000$150/sqft |
Source: Prime Real Estate #09522636 Report a problem | ||
| 3/6/2017 | Listed for sale | $250,000-9.1%$150/sqft |
Source: Prime Real Estate #09522636 Report a problem | ||
| 1/27/2017 | Listing removed | $275,000$165/sqft |
Source: Coldwell Banker Residential Brokerage - Orland Park #09295935 Report a problem | ||
| 7/24/2016 | Listed for sale | $275,000-42.1%$165/sqft |
Source: Coldwell Banker Residential Brokerage - Orland Park #09295935 Report a problem | ||
| 7/6/2015 | Listing removed | $475,000$285/sqft |
Source: McColly Bennett Real Estate #08968700 Report a problem | ||
| 6/30/2015 | Listed for sale | $475,000$285/sqft |
Source: McColly Bennett Real Estate #08968700 Report a problem | ||
| 5/21/2015 | Listing removed | $475,000$285/sqft |
Source: McColly Bennett Real Estate #08623611 Report a problem | ||
| 5/24/2014 | Listed for sale | $475,000$285/sqft |
Source: McColly Real Estate #08623611 Report a problem | ||
| Year | Property taxes | Tax assessment |
|---|---|---|
| 2024 | $1,932 -5.9% | $63,202 +10.3% |
| 2023 | $2,053 -12.5% | $57,284 +9% |
| 2022 | $2,346 -11.7% | $52,535 +7.9% |
| 2021 | $2,657 -4.3% | $48,689 +7.3% |
| 2020 | $2,778 -2.6% | $45,397 +6.4% |
| 2019 | $2,853 -4.1% | $42,674 +6.5% |
| 2018 | $2,976 -1.3% | $40,069 +3.6% |
| 2017 | $3,015 -2.1% | $38,684 |
| 2016 | $3,080 +3.2% | $38,684 +1.1% |
| 2015 | $2,986 | $38,263 -1% |
| 2014 | $2,986 +0.3% | $38,650 -4.3% |
| 2013 | $2,977 +1% | $40,370 -6% |
| 2012 | $2,949 +8.5% | $42,947 -6.7% |
| 2011 | $2,717 +7.4% | $46,036 -1.2% |
| 2010 | $2,531 -16.1% | $46,618 -1.4% |
| 2009 | $3,018 +26.7% | $47,280 |
| 2008 | $2,382 | $47,280 +7.5% |
| 2007 | -- | $43,965 +8.1% |
| 2006 | $2,579 -2.9% | $40,671 +1.8% |
| 2005 | $2,655 +11.5% | $39,952 +4.2% |
| 2004 | $2,381 -6.3% | $38,324 |
| 2003 | $2,540 | $38,324 |
Find assessor info on the county website
Source: MRED as distributed by MLS GRID. This data may not be complete. We recommend contacting the local school district to confirm school assignments for this home.
A local agent can set up tours, give advice and negotiate with sellers.
A local lender can help you make sure your offer is ready when you are.