$227,900
2 bd|1 ba|900 sqft
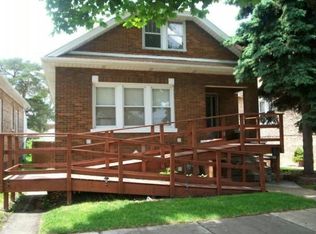
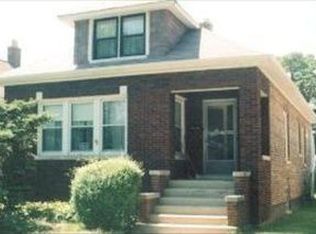
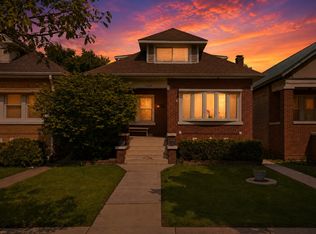
1534 Clinton Ave, Berwyn, IL 60402
Off Market
Likely to sell faster than
Zillow last checked:
Listing updated:
Yasmin Perez, CSC 331-330-0651,
OnPath Realty Inc.,
Gayle Ornelas 815-766-1593,
OnPath Realty Inc
Not available
Estimated sales range
Not available
Not available
| Date | Event | Price |
|---|---|---|
| 6/7/2026 | Contingent | $415,000$208/sqft |
Source: | ||
| 5/28/2026 | Listed for sale | $415,000+22.1%$208/sqft |
Source: | ||
| 3/18/2020 | Sold | $340,000+1.5%$170/sqft |
Source: | ||
| 2/21/2020 | Pending sale | $334,999$167/sqft |
Source: Realty of Chicago LLC #10612760 Report a problem | ||
| 1/17/2020 | Listed for sale | $334,999-5.6%$167/sqft |
Source: Realty of Chicago LLC #10612760 Report a problem | ||
| 11/11/2019 | Listing removed | $354,900$177/sqft |
Source: Keller Williams North Shore West #10460203 Report a problem | ||
| 9/10/2019 | Price change | $354,900-1.4%$177/sqft |
Source: Keller Williams North Shore West #10460203 Report a problem | ||
| 7/23/2019 | Listed for sale | $359,900+38.4%$180/sqft |
Source: Keller Williams North Shore West #10460203 Report a problem | ||
| 8/20/2013 | Sold | $260,000+2%$130/sqft |
Source: Public Record Report a problem | ||
| 7/2/2013 | Pending sale | $254,900$127/sqft |
Source: Premiere Plus Realty llc #08379771 Report a problem | ||
| 6/27/2013 | Listed for sale | $254,900+280.4%$127/sqft |
Source: Premiere Plus Realty llc #08379771 Report a problem | ||
| 4/11/2013 | Sold | $67,000+9.9%$34/sqft |
Source: Public Record Report a problem | ||
| 1/29/2013 | Listed for sale | $60,990-69.5%$30/sqft |
Source: Homepath #08259539 Report a problem | ||
| 7/5/2005 | Sold | $200,000+42.9%$100/sqft |
Source: Public Record Report a problem | ||
| 4/18/2005 | Sold | $140,000$70/sqft |
Source: Public Record Report a problem | ||
| Year | Property taxes | Tax assessment |
|---|---|---|
| 2024 | -- | $27,001 +0% |
| 2023 | $7,447 -3.4% | $26,999 +40.4% |
| 2022 | $7,707 +5% | $19,229 |
| 2021 | $7,340 +1058.1% | $19,229 |
| 2020 | $634 | $19,229 +6.6% |
| 2019 | -- | $18,032 |
| 2018 | -- | $18,032 |
| 2017 | -- | $18,032 +56.2% |
| 2016 | -- | $11,545 |
| 2015 | -- | $11,545 -51.9% |
| 2014 | $9,687 +122.6% | $24,010 +62.7% |
| 2013 | $4,351 +5.2% | $14,761 |
| 2012 | $4,136 -3.9% | $14,761 |
| 2011 | $4,306 +3.2% | $14,761 -18.9% |
| 2010 | $4,171 +8.6% | $18,193 |
| 2009 | $3,841 -29.6% | $18,193 -15% |
| 2008 | $5,454 +5.9% | $21,404 +11.4% |
| 2007 | $5,151 +7.7% | $19,215 |
| 2006 | $4,784 -0.5% | $19,215 |
| 2005 | $4,808 +37.4% | $19,215 +36.9% |
| 2004 | $3,498 +2.3% | $14,039 |
| 2003 | $3,420 +5.8% | $14,039 |
| 2002 | $3,233 +23.4% | $14,039 +28% |
| 2001 | $2,621 -1.4% | $10,969 |
| 2000 | $2,657 +10% | $10,969 |
| 1999 | $2,416 | $10,969 |
Find assessor info on the county website
Source: MRED as distributed by MLS GRID. This data may not be complete. We recommend contacting the local school district to confirm school assignments for this home.
A local agent can set up tours, give advice and negotiate with sellers.
A local lender can help you make sure your offer is ready when you are.