Welcome to an exceptional investment opportunity in one of Indianapolis's most vibrant corridors! Nestled in the desirable Bates-Hendricks neighborhood and just moments from the heart of Fountain Square, this turnkey duplex perfectly blends urban convenience with incredible financial potential. Whether you're an experienced investor looking to expand a portfolio or a savvy homebuyer seeking an income-producing "owner-occupied play," this property delivers on every level. Each spacious, two-story unit 3 bedrooms, 1.5 bathrooms, and thoughtfully laid-out living spaces filled with natural light. With strong rental potential, flexible long-term strategy options, and a location surrounded by popular local dining, boutiques, and entertainment, the numbers truly work from every angle. Step inside, unlock the possibilities, and set yourself up for immediate success!
Active
$295,000
1553 Barth Ave, Indianapolis, IN 46203
6beds
4baths
--sqft
Multi Family, Duplex
Built in 1922
-- sqft lot
$-- Zestimate®
$--/sqft
$-- HOA
What's special
Spacious two-story unit
- 33 days
- 389
- 38
Zillow last checked:
Listing updated:
Listed by:
Daniel Fisher rex@atpropertiesind.com,
@properties,
Eric Weidman,
@properties
Source: MIBOR as distributed by MLS GRID,MLS#: 22128221
Facts & features
Interior
Bedrooms & bathrooms
- Bedrooms: 6
- Bathrooms: 4
- Main level bathrooms: 6
Appliances
- Laundry: Connections All
Features
- Has basement: Yes
Property
Parking
- Details: Unit Parking(On Street)
Lot
- Size: 3,484 Square Feet
- Features: Not Applicable
Details
- Parcel number: 491113150002000101
Construction
Type & style
- Home type: MultiFamily
- Property subtype: Multi Family, Duplex
Materials
- Vinyl Siding
Condition
- New construction: No
- Year built: 1922
Community & HOA
Community
- Security: Smoke Detector(s)
- Subdivision: Bates
Location
- Region: Indianapolis
Financial & listing details
- Tax assessed value: $232,900
- Annual tax amount: $5,578
- Date on market: 10/16/2026
- Cumulative days on market: 28 days
- Tenant pays: Cable TV, Insurance, All Utilities, Water
Estimated market value
Not available
Estimated sales range
Not available
Not available
Price history
| Date | Event | Price |
|---|---|---|
| 11/2/2026 | Listed for sale | $295,000 |
Source:  MIBOR as distributed by MLS GRID #22128221 Report a problem | ||
| 10/27/2026 | Pending sale | $295,000 |
Source: MIBOR as distributed by MLS GRID #22128221 Report a problem | ||
| 10/16/2026 | Listed for sale | $295,000+34.1% |
Source: MIBOR as distributed by MLS GRID #22128221 Report a problem | ||
| 9/3/2021 | Listing removed | -- |
Source: Zillow Rental Manager Report a problem | ||
| 8/25/2021 | Listed for rent | $1,250 |
Source: Zillow Rental Manager Report a problem | ||
| 8/3/2021 | Listing removed | -- |
Source: Zillow Rental Manager Report a problem | ||
| 7/6/2021 | Listed for rent | $1,250+4.3% |
Source: Zillow Rental Manager Report a problem | ||
| 12/14/2020 | Listing removed | $1,199 |
Source: Zillow Rental Manager Report a problem | ||
| 10/7/2020 | Price change | $1,199-4.1% |
Source: Zillow Rental Manager Report a problem | ||
| 9/3/2020 | Listed for rent | $1,250-2% |
Source: Zillow Rental Manager Report a problem | ||
| 6/22/2020 | Listing removed | $1,275 |
Source: Zillow Rental Manager Report a problem | ||
| 6/8/2020 | Listed for rent | $1,275+6.3% |
Source: Zillow Rental Manager Report a problem | ||
| 4/20/2018 | Listing removed | $1,200 |
Source: Owner Report a problem | ||
| 3/26/2018 | Listed for rent | $1,200 |
Source: Owner Report a problem | ||
| 5/5/2017 | Listing removed | $1,200 |
Source: Owner Report a problem | ||
| 1/20/2017 | Listed for rent | $1,200 |
Source: Owner Report a problem | ||
| 1/12/2017 | Sold | $220,000 |
Source: Public Record Report a problem | ||
| 11/26/2016 | Listing removed | $1,200+20% |
Source: Owner Report a problem | ||
| 6/18/2015 | Listing removed | $1,000 |
Source: Owner Report a problem | ||
| 5/19/2015 | Listed for rent | $1,000 |
Source: Owner Report a problem | ||
Public tax history
| Year | Property taxes | Tax assessment |
|---|---|---|
| 2025 | $5,593 +4.8% | $232,900 -1.2% |
| 2024 | $5,337 +0.5% | $235,700 +4.8% |
| 2023 | $5,312 +17.5% | $225,000 |
| 2022 | $4,522 +5.4% | $225,000 +14.8% |
| 2021 | $4,289 -23.6% | $196,000 +5.8% |
| 2020 | $5,616 +9.6% | $185,200 -22.2% |
| 2019 | $5,124 +192.5% | $237,900 +10.6% |
| 2018 | $1,752 +9.6% | $215,100 +170.6% |
| 2017 | $1,599 +6.6% | $79,500 +9.7% |
| 2016 | $1,500 +4.9% | $72,500 +9.7% |
| 2014 | $1,429 -3.4% | $66,100 |
| 2013 | $1,479 | $66,100 +0.6% |
| 2012 | $1,479 | $65,700 +34.6% |
| 2011 | -- | $48,800 |
| 2010 | $1,019 -2.4% | $48,800 |
| 2009 | $1,044 | $48,800 +12.7% |
| 2007 | -- | $43,300 |
Find assessor info on the county website
Monthly payment
Est. payment
Payment breakdown
Explore the cost of this home by adjusting the details. Changes won't be saved.Climate risks
Neighborhood: Near Southside


Similar homes
- $310,0005 bd2 ba2.2k sqft910 Villa Ave, Indianapolis, IN 46203Active
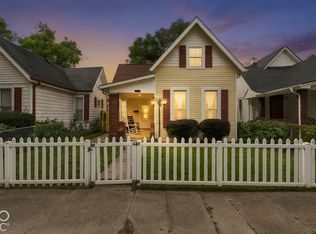 MLS ID #22128200, Amber Russell, Keller Williams Indy Metro NE. MIBOR as distributed by MLS GRID
- $270,0005 bd2 ba3.5k sqft941 E Raymond St, Indianapolis, IN 46203Active
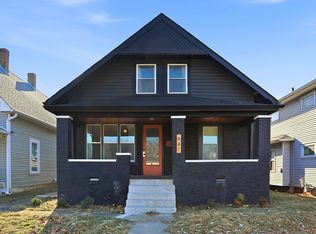 MLS ID #22122557, Brayden Sammons, Keller Williams Indy Metro Partners. MIBOR as distributed by MLS GRID
- $279,0004 bd2 ba2.4k sqft729 E Morris St, Indianapolis, IN 46203Active
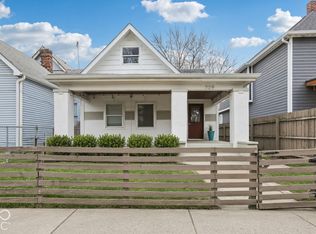 MLS ID #22130471, Tyler Renick, Tyler Knows Real Estate LLC. MIBOR as distributed by MLS GRID
- $325,0003 bd3 ba3k sqft523 Parkway Ave, Indianapolis, IN 46203Active
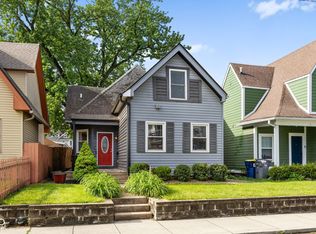 MLS ID #22102983, Kristin Glassburn, @properties. MIBOR as distributed by MLS GRID
