Incredible investment opportunity in a great Raleigh neighborhood\! This duplex features two separate units, each offering 2 bedrooms, 1 bath, living room, dining area, kitchen, and its own basement\. Situated on an exceptional lot, this property offers excellent potential for investors or owner\-occupants\. Property consists of 1604 and 1606 Pineview Street. **Seller is a licensed real estate agent\.** Reach out for additional details.
For sale by owner
$925,000
1604 Pineview St, Raleigh, NC 27608
4beds
2,640sqft
MultiFamily
Built in 1941
-- sqft lot
$-- Zestimate®
$350/sqft
$-- HOA
What's special
Its own basementTwo separate unitsExceptional lotDining area
- 16 days
- 623
- 41
Listed by:
Property Owner (252) 258-6000
Facts & features
Interior
Bedrooms & bathrooms
- Bedrooms: 4
- Bathrooms: 2
- Full bathrooms: 2
Heating
- Forced air
Interior area
- Total interior livable area: 2,640 sqft
Property
Features
- Exterior features: Brick
Lot
- Size: 10,018 Square Feet
Details
- Parcel number: 1704265445
Construction
Type & style
- Home type: MultiFamily
Condition
- New construction: No
- Year built: 1941
Community & HOA
Location
- Region: Raleigh
Financial & listing details
- Price per square foot: $350/sqft
- Tax assessed value: $753,369
- Annual tax amount: $6,610
- Date on market: 10/27/2026
Estimated market value
Not available
Estimated sales range
Not available
$3,050/mo
Price history
| Date | Event | Price |
|---|---|---|
| 10/27/2026 | Listed for sale | $925,000+99.8%$350/sqft |
Source: Owner Report a problem | ||
| 10/13/2014 | Sold | $463,000+74.7%$175/sqft |
Source: Public Record Report a problem | ||
| 10/9/1998 | Sold | $265,000$100/sqft |
Source: Public Record Report a problem | ||
Public tax history
| Year | Property taxes | Tax assessment |
|---|---|---|
| 2025 | $6,610 +0.4% | $753,369 |
| 2024 | $6,583 +14.8% | $753,369 +44.2% |
| 2023 | $5,736 +7.6% | $522,560 |
| 2022 | $5,331 +4% | $522,560 |
| 2021 | $5,125 +1.8% | $522,560 |
| 2020 | $5,031 -8.4% | $522,560 +11.1% |
| 2019 | $5,492 | $470,483 |
| 2018 | $5,492 +11.3% | $470,483 |
| 2017 | $4,934 +2.1% | $470,483 |
| 2016 | $4,833 +11.6% | $470,483 +13.6% |
| 2015 | $4,330 | $414,331 |
| 2014 | -- | $414,331 |
| 2013 | -- | $414,331 |
| 2012 | -- | $414,331 |
| 2011 | -- | $414,331 |
| 2010 | -- | $414,331 |
| 2009 | -- | $414,331 |
| 2008 | -- | -- |
| 2007 | -- | -- |
| 2006 | -- | -- |
| 2005 | -- | -- |
| 2004 | -- | -- |
| 2003 | -- | -- |
| 2002 | -- | -- |
| 2001 | -- | -- |
Find assessor info on the county website
Monthly payment
Est. payment
Payment breakdown
Explore the cost of this home by adjusting the details. Changes won't be saved.Climate risks
Neighborhood: Hillsborough

Similar homes
- $925,0004 bd3 ba3.3k sqft1003 Gardner St, Raleigh, NC 27607For Sale
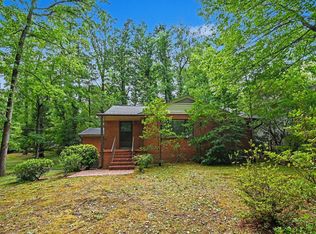
 MLS ID #10179270, Beth Smoot. Doorify MLS
- $795,0003 bd2 ba2.2k sqft2009 McCarthy St, Raleigh, NC 27608For Sale
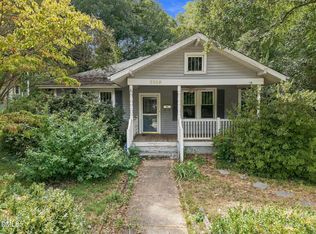 MLS ID #10195723, Marshall Rich. Doorify MLS
- $835,0003 bd2 ba1.4k sqft1908 White Oak Rd, Raleigh, NC 27608For Sale
 MLS ID #10200928, Anne Wayne Prosser. Doorify MLS
- $1,100,0005 bd4 ba2.8k sqft2012 Glenwood Ave, Raleigh, NC 27608For Sale
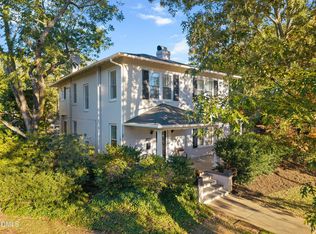 MLS ID #10200001, Casey House. Doorify MLS
- $1,165,0004 bd3 ba2.4k sqft3012 Mayview Rd, Raleigh, NC 27607For SaleMLS ID #10202980, Todd Hancock. Doorify MLS
- $899,0004 bd4 ba2.5k sqft1209 Harp St, Raleigh, NC 27604For SaleMLS ID #10200056, Cynthia Quarantello. Doorify MLS
- $1,250,0005 bd4 ba3.9k sqft1312 Diehl St, Raleigh, NC 27608For SaleMLS ID #10200584, Franklin Munford. Doorify MLS
- $879,0003 bd3 ba2.3k sqft1917 Sunset Dr, Raleigh, NC 27608For SaleMLS ID #10180823, Kathy Tambke. Doorify MLS
- $885,0003 bd3 ba2k sqft2718 Peachtree St, Raleigh, NC 27608For SaleMLS ID #10151751, Dustin Hickman. Doorify MLS
- $1,195,0004 bd3 ba2.5k sqft1509 Caswell St, Raleigh, NC 27608For SaleMLS ID #10174474, Graham Young. Doorify MLS
- $897,0003 bd3 ba2.2k sqft2308 Wade Ave, Raleigh, NC 27607For SaleMLS ID #10195585, Bart Riddick. Doorify MLS
- $899,0003 bd4 ba2.2k sqft2615 Saint Marys St, Raleigh, NC 27609For SaleMLS ID #10197901, William McElroy. Doorify MLS
- $850,0004 bd3 ba2.5k sqft789 Fallon Grove Way, Raleigh, NC 27608For SaleMLS ID #10191162, David Wilson. Doorify MLS
- $1,050,0005 bd3 ba3.2k sqft502 Tilden St, Raleigh, NC 27605For SaleMLS ID #10199705, Timothy James Wadford. Doorify MLS
- $955,0004 bd4 ba2.5k sqft1141 N Blount St, Raleigh, NC 27604For SaleMLS ID #10197503, Yohannes Melaku Kibret. Doorify MLS
- $844,0004 bd2 ba2.2k sqft414 S Boylan Ave, Raleigh, NC 27603For SaleMLS ID #10200273, Erica Jevons Sizemore. Doorify MLS
- $660,0004 bd4 ba2.8k sqft2332 Noble Rd, Raleigh, NC 27608For SaleMLS ID #10202339, Mary Burr Edwards. Doorify MLS
- $950,0004 bd2 ba2.2k sqft517 N East St, Raleigh, NC 27604For SaleMLS ID #10176694, Terri Poulsen. Doorify MLS
- $835,0003 bd3 ba1.7k sqft709 W North St, Raleigh, NC 27603For SaleMLS ID #10202306, Brad Sterman. Doorify MLS
- $959,0006 bd5 ba3.4k sqft116 Hawthorne Rd, Raleigh, NC 27605For SaleMLS ID #10182428, Ashley Hum. Doorify MLS
