Fully remodeled house perfect for a family that wants to have a pool and relax
For sale by owner
$290,000
1627 Providence Blvd, Deltona, FL 32725
3beds
1,311sqft
SingleFamily
Built in 1970
0.33 Acres Lot
$-- Zestimate®
$221/sqft
$-- HOA
What's special
Fully remodeled house
- 14 days
- 815
- 99
Listed by:
Property Owner (305) 978-1916
Facts & features
Interior
Bedrooms & bathrooms
- Bedrooms: 3
- Bathrooms: 2
- Full bathrooms: 2
Heating
- Forced air
Appliances
- Included: Dryer, Refrigerator
Features
- Flooring: Tile, Other
Interior area
- Total interior livable area: 1,311 sqft
Property
Parking
- Parking features: Garage - Attached
Features
- Exterior features: Stucco, Cement / Concrete
Lot
- Size: 0.33 Acres
Details
- Parcel number: 813072120090
Construction
Type & style
- Home type: SingleFamily
Materials
- masonry
- Foundation: Slab
- Roof: Asphalt
Condition
- New construction: No
- Year built: 1970
Community & HOA
Location
- Region: Deltona
Financial & listing details
- Price per square foot: $221/sqft
- Tax assessed value: $197,942
- Annual tax amount: $4,160
- Date on market: 10/6/2026
Estimated market value
Not available
Estimated sales range
Not available
$2,187/mo
Price history
| Date | Event | Price |
|---|---|---|
| 10/6/2026 | Listed for sale | $290,000-13.4%$221/sqft |
Source: Owner Report a problem | ||
| 10/24/2025 | Listing removed | $335,000$256/sqft |
Source:  Stellar MLS #S5116193 Report a problem | ||
| 10/14/2025 | Price change | $2,150-10.4%$2/sqft |
Source: Stellar MLS #S5134996 Report a problem | ||
| 10/14/2025 | Price change | $335,000-4%$256/sqft |
Source: Stellar MLS #S5116193 Report a problem | ||
| 9/20/2025 | Listed for rent | $2,400$2/sqft |
Source: Stellar MLS #S5134996 Report a problem | ||
| 7/1/2025 | Listed for sale | $349,000-3.1%$266/sqft |
Source: Stellar MLS #S5116193 Report a problem | ||
| 5/28/2025 | Listing removed | $360,000$275/sqft |
Source: Stellar MLS #S5116193 Report a problem | ||
| 3/9/2025 | Price change | $360,000-2.7%$275/sqft |
Source: Stellar MLS #S5116193 Report a problem | ||
| 12/6/2024 | Listed for sale | $370,000+60.9%$282/sqft |
Source: Stellar MLS #S5116193 Report a problem | ||
| 5/9/2024 | Sold | $230,000-22%$175/sqft |
Source: Stellar MLS #NS1081170 Report a problem | ||
| 4/18/2024 | Pending sale | $295,000$225/sqft |
Source: Stellar MLS #NS1081170 Report a problem | ||
| 4/18/2024 | Listed for sale | $295,000$225/sqft |
Source: Stellar MLS #NS1081170 Report a problem | ||
| 4/15/2024 | Pending sale | $295,000$225/sqft |
Source: Stellar MLS #NS1081170 Report a problem | ||
| 4/11/2024 | Listed for sale | $295,000+247.5%$225/sqft |
Source: Stellar MLS #NS1081170 Report a problem | ||
| 10/28/2013 | Sold | $84,900+78.7%$65/sqft |
Source: Public Record Report a problem | ||
| 6/6/2013 | Sold | $47,500-29.1%$36/sqft |
Source: Public Record Report a problem | ||
| 10/21/1998 | Sold | $67,000+11.9%$51/sqft |
Source: Public Record Report a problem | ||
| 11/1/1994 | Sold | $59,900$46/sqft |
Source: Public Record Report a problem | ||
Public tax history
| Year | Property taxes | Tax assessment |
|---|---|---|
| 2025 | $4,160 +18.8% | $197,942 +34.7% |
| 2024 | $3,503 -0.9% | $146,957 +10% |
| 2023 | $3,535 +9.9% | $133,597 +10% |
| 2022 | $3,216 | $121,452 +10% |
| 2021 | -- | $110,411 +10% |
| 2020 | $2,791 | $100,374 -27% |
| 2019 | $2,791 +4.2% | $137,454 +17.7% |
| 2018 | $2,679 +9.3% | $116,796 +27.2% |
| 2017 | $2,451 +11.1% | $91,820 +33.3% |
| 2016 | $2,206 +15.3% | $68,866 +10.5% |
| 2015 | $1,913 +5.9% | $62,325 +9.4% |
| 2014 | $1,806 | $56,976 +7.1% |
| 2013 | -- | $53,193 +10.2% |
| 2012 | -- | $48,253 -12.6% |
| 2011 | -- | $55,227 -17.9% |
| 2010 | -- | $67,278 -11.9% |
| 2009 | -- | $76,331 +3.1% |
| 2007 | -- | $74,034 -0.5% |
| 2006 | -- | $74,395 +6.1% |
| 2005 | -- | $70,124 +3% |
| 2004 | -- | $68,082 +1.9% |
| 2003 | -- | $66,813 +2.4% |
| 2002 | -- | $65,247 +1.6% |
| 2001 | -- | $64,220 +3% |
| 2000 | -- | $62,350 |
Find assessor info on the county website
Monthly payment
Est. payment
Payment breakdown
Explore the cost of this home by adjusting the details. Changes won't be saved.Climate risks
Neighborhood: 32725
Similar homes
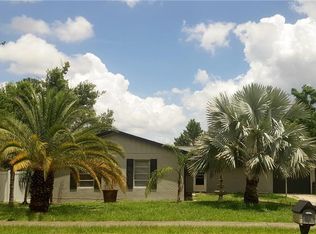
- $289,0003 bd2 ba1.3k sqft675 HAGER STREET, DELTONA, FL 32725For Sale
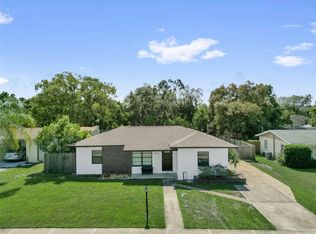
 MLS ID #O6446093, Christina Moodie, KELLER WILLIAMS HERITAGE REALTY. Stellar MLS
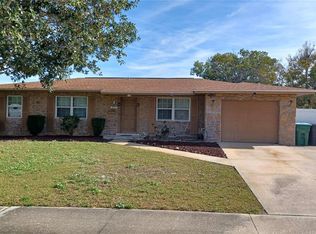
- $292,5003 bd2 ba1.3k sqft1013 SULLIVAN STREET, DELTONA, FL 32725For Sale
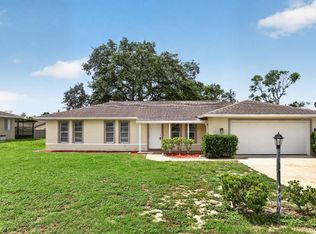 MLS ID #TB8527131, Stephen Hachey, FLAT FEE MLS REALTY. Stellar MLS
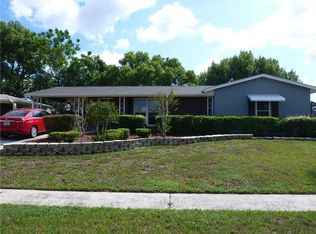
- $299,9993 bd2 ba1.4k sqft1148 FOUNTAINHEAD DRIVE, DELTONA, FL 32725For Sale
 MLS ID #O6434241, Melissa Pabon, ICON REALTY ADVISORS FTL. Stellar MLS
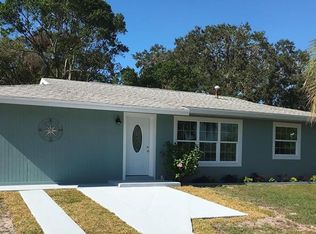
- $299,0003 bd2 ba1.1k sqft1441 NE OLD MILL DRIVE, DELTONA, FL 32725For Sale
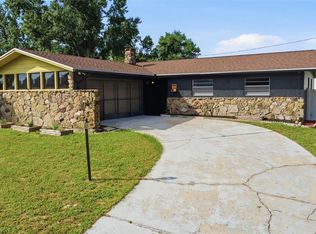 MLS ID #O6427628, Jodi Naugler, PREFERRED REAL ESTATE BROKERS. Stellar MLS
- $279,0003 bd3 ba1.2k sqft2715 TIMBERLAKE AVENUE, DELTONA, FL 32725For SaleMLS ID #O6420275, Wendy Aldana LLC, PREFERRED REAL ESTATE BROKERS. Stellar MLS
- $325,0004 bd2 ba1.5k sqft2067 E BARLINGTON DRIVE, DELTONA, FL 32725For SaleMLS ID #O6418562, Jose Diaz, ALLIANCE REALTY ENTERPRISES INC. Stellar MLS
- $399,0004 bd2 ba1.8k sqft1974 E COOPER DRIVE, DELTONA, FL 32725For SaleMLS ID #O6450773, Matthew Hughes, CHARLES RUTENBERG REALTY ORLANDO. Stellar MLS
- $279,9003 bd2 ba1.6k sqft2695 KEENE LANE, DELTONA, FL 32725For SaleMLS ID #V4949860, Skylor McGough, DASH REAL ESTATE COMPANY. Stellar MLS
- $235,0002 bd2 ba1.3k sqft1539 FORT SMITH BOULEVARD, DELTONA, FL 32725For SaleMLS ID #O6427881, Thomas Nickley, Jr, KELLER WILLIAMS REALTY AT THE PARKS. Stellar MLS
- $329,9003 bd2 ba1.4k sqft226 COUNCIL BLUFFS DRIVE, DELTONA, FL 32725For SaleMLS ID #V4950744, Kim Laney, FLORIDA REALTY INVESTMENTS. Stellar MLS
- $350,0003 bd2 ba1.5k sqft1160 MANITOBA STREET, DELTONA, FL 32725For SaleMLS ID #O6430771, Jessica Snyder, LPT REALTY, LLC. Stellar MLS
- $358,0004 bd3 ba1.8k sqft1483 TIVOLI DRIVE, DELTONA, FL 32725For SaleMLS ID #O6426846, Claudia Velez, BELLA HOUSE REALTY. Stellar MLS
- $319,9993 bd2 ba1.5k sqft2992 INCA COURT, DELTONA, FL 32738For SaleMLS ID #V4951624, Scarlett Napolitano, LPT REALTY LLC. Stellar MLS
- $350,0003 bd2 ba1.7k sqft1412 DIGARMO TERRACE, DELTONA, FL 32725For SaleMLS ID #O6398669, Jenny Wemert, WEMERT GROUP REALTY LLC. Stellar MLS
- $280,0003 bd2 ba1.3k sqft745 MENTMORE CIRCLE, DELTONA, FL 32738For SaleMLS ID #O6406730, Jenny Wemert, WEMERT GROUP REALTY LLC. Stellar MLS
- $314,9994 bd2 ba1.6k sqft226 HAVERSHAM ROAD, DELTONA, FL 32725For SaleMLS ID #TB8436021, Keegan Siegfried, LPT REALTY, LLC. Stellar MLS
- $275,0003 bd2 ba1.1k sqft209 DELESPINE DRIVE, DEBARY, FL 32713For SaleMLS ID #V4951637, Gernelle Bokuniewicz, LIVELY REAL ESTATE. Stellar MLS
- $299,8003 bd2 ba1.3k sqft102 AMIGOS ROAD, DEBARY, FL 32713For SaleMLS ID #S5153827, Kareem Gomes, SEQUOIA REALTY GROUP, LLC.. Stellar MLS
- $349,0003 bd3 ba1.5k sqft783 S ATMORE CIRCLE, DELTONA, FL 32725For SaleMLS ID #V4948227, Zenaida Santiago, IRON VALLEY REAL ESTATE DELTONA LAKES. Stellar MLS
- $280,0003 bd2 ba1k sqft1315 E VOORHIS AVENUE, DELAND, FL 32724For SaleMLS ID #O6449319, Kelita Uzcategui, VENOSA REALTY LLC. Stellar MLS
