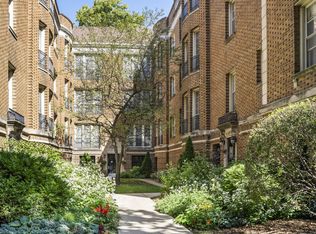
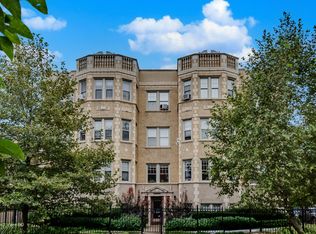
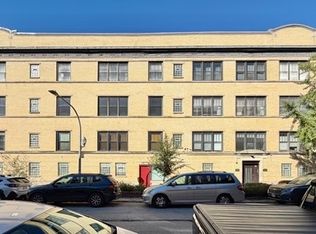
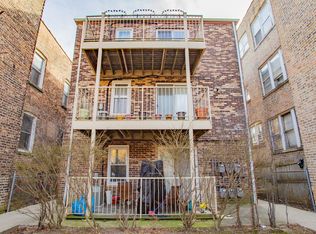
$235,000
3 bd2 ba-- sqft
1745 W Albion Ave APT 1N, Chicago, IL 60626
Sold

Listing description withheld by the listing agent.
Zillow last checked:
Listing updated:
Brian Miller 815-491-0509,
Realty of America

Not available
Estimated sales range
Not available
Not available
| Date | Event | Price |
|---|---|---|
| 10/25/2018 | Listing removed | $1,350$1/sqft |
Source: Raider Realty Report a problem | ||
| 10/10/2018 | Price change | $1,350-3.6%$1/sqft |
Source: Raider Realty Report a problem | ||
| 8/23/2018 | Price change | $1,400-3.4%$1/sqft |
Source: Raider Realty Report a problem | ||
| 8/18/2018 | Listed for rent | $1,450$1/sqft |
Source: Raider Realty Report a problem | ||
| 6/4/2014 | Sold | $148,000+9.7%$114/sqft |
Source:  MRED as distributed by MLS GRID #08548792 Report a problem | ||
| 5/31/2014 | Pending sale | $134,900$104/sqft |
Source: Jason Shapiro #08548792 Report a problem | ||
| 5/29/2014 | Price change | $134,900-12.9%$104/sqft |
Source: Jason Shapiro #08548792 Report a problem | ||
| 4/16/2014 | Pending sale | $154,900$119/sqft |
Source: Jason Shapiro #08548792 Report a problem | ||
| 4/16/2014 | Listed for sale | $154,900$119/sqft |
Source: Jason Shapiro #08548792 Report a problem | ||
| 3/16/2014 | Listing removed | $154,900$119/sqft |
Source: Jason Shapiro #08548792 Report a problem | ||
| 3/4/2014 | Listed for sale | $154,900-32.7%$119/sqft |
Source: Jason Shapiro #08548792 Report a problem | ||
| 10/24/2006 | Sold | $230,000$177/sqft |
Source: Public Record Report a problem | ||
| Year | Property taxes | Tax assessment |
|---|---|---|
| 2024 | $4,288 -2.2% | $21,341 +2.7% |
| 2023 | $4,384 -3.1% | $20,777 -5.6% |
| 2022 | $4,525 +2.3% | $21,999 |
| 2021 | $4,424 +69% | $21,999 +87.2% |
| 2020 | $2,617 -0.5% | $11,749 -10.3% |
| 2019 | $2,632 +1.7% | $13,098 |
| 2018 | $2,587 -9.3% | $13,098 -1.2% |
| 2017 | $2,853 +7.5% | $13,253 |
| 2016 | $2,654 +9.3% | $13,253 |
| 2015 | $2,429 -37.3% | $13,253 -36.5% |
| 2014 | $3,873 +2% | $20,875 |
| 2013 | $3,797 +1.4% | $20,875 |
| 2012 | $3,746 +7.6% | $20,875 -2.8% |
| 2011 | $3,481 -0.4% | $21,481 |
| 2010 | $3,495 +4.4% | $21,481 |
| 2009 | $3,350 +6% | $21,481 -2.5% |
| 2008 | $3,160 +1% | $22,030 |
| 2007 | $3,129 | $22,030 |
Source: MRED as distributed by MLS GRID. This data may not be complete. We recommend contacting the local school district to confirm school assignments for this home.


A local agent can set up tours, give advice and negotiate with sellers.