$171,000
3 bd|1 ba|1k sqft
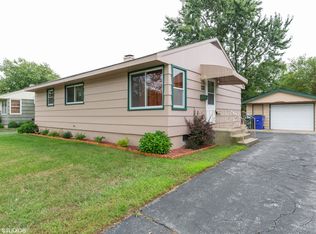
21 Mohawk Dr, Thornton, IL 60476
Off Market
Zillow last checked:
Mireida Escobedo 708-789-2772,
HomeSmart Realty Group
Not available
Estimated sales range
Not available
Not available
| Date | Event | Price |
|---|---|---|
| 5/20/2026 | Listing removed | $254,900$274/sqft |
Source: | ||
| 11/20/2025 | Listed for sale | $254,900+27.5%$274/sqft |
Source: | ||
| 6/6/2022 | Sold | $200,000+5.3%$215/sqft |
Source: | ||
| 5/6/2022 | Contingent | $189,900$204/sqft |
Source: | ||
| 5/3/2022 | Listed for sale | $189,900+111%$204/sqft |
Source: | ||
| 4/30/2013 | Sold | $90,000-9.5%$97/sqft |
Source: | ||
| 3/21/2013 | Pending sale | $99,500$107/sqft |
Source: CENTURY 21 Affiliated Pro-Team #08258008 Report a problem | ||
| 3/19/2013 | Price change | $99,500-0.5%$107/sqft |
Source: CENTURY 21 Affiliated Pro-Team #08258008 Report a problem | ||
| 1/28/2013 | Price change | $100,000-5.6%$107/sqft |
Source: Century 21 Pro-Team #08258008 Report a problem | ||
| 8/14/2012 | Price change | $105,900-2.8%$114/sqft |
Source: CENTURY 21 Pro-Team #08121438 Report a problem | ||
| 7/24/2012 | Price change | $108,900-9.2%$117/sqft |
Source: Century 21 Pro-Team #08121438 Report a problem | ||
| 6/27/2012 | Listed for sale | $119,900-7%$129/sqft |
Source: CirclePix #08010754 Report a problem | ||
| 4/17/2012 | Listing removed | $128,900$138/sqft |
Source: CirclePix #08010754 Report a problem | ||
| 3/23/2012 | Listed for sale | $128,900+7.4%$138/sqft |
Source: CirclePix #08010754 Report a problem | ||
| 6/13/2007 | Sold | $120,000$129/sqft |
Source: Public Record Report a problem | ||
| Year | Property taxes | Tax assessment |
|---|---|---|
| 2024 | -- | $15,000 |
| 2023 | $7,558 +87.4% | $15,000 +55% |
| 2022 | $4,033 +4.1% | $9,679 |
| 2021 | $3,875 +1% | $9,679 |
| 2020 | $3,838 +24.6% | $9,679 +11.3% |
| 2019 | $3,079 +4.4% | $8,699 |
| 2018 | $2,950 -1.1% | $8,699 |
| 2017 | $2,981 -28.1% | $8,699 -12.8% |
| 2016 | $4,148 +7.6% | $9,978 |
| 2015 | $3,856 +2% | $9,978 |
| 2014 | $3,781 +18.5% | $9,978 +2.2% |
| 2013 | $3,192 +0.2% | $9,767 |
| 2012 | $3,187 -2.1% | $9,767 |
| 2011 | $3,253 -9.1% | $9,767 -15.3% |
| 2010 | $3,580 +6.3% | $11,528 |
| 2009 | $3,367 +18.6% | $11,528 -5% |
| 2008 | $2,838 +3.5% | $12,134 -0.7% |
| 2007 | $2,743 +5.6% | $12,216 |
| 2006 | $2,597 +12% | $12,216 |
| 2005 | $2,318 -9.8% | $12,216 +9.9% |
| 2004 | $2,571 +0% | $11,119 |
| 2003 | $2,570 +1.3% | $11,119 |
| 2002 | $2,537 +13.9% | $11,119 +7% |
| 2001 | $2,228 +1.9% | $10,395 |
| 2000 | $2,185 +12.4% | $10,395 |
| 1999 | $1,945 | $10,395 |
Find assessor info on the county website
Source: MRED as distributed by MLS GRID. This data may not be complete. We recommend contacting the local school district to confirm school assignments for this home.
A local agent can set up tours, give advice and negotiate with sellers.