$393,900
4 bd|2 ba|2.3k sqft
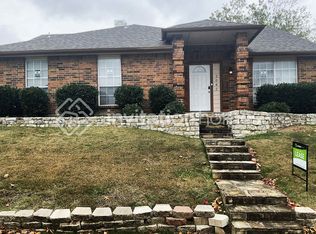
2082 Briarcliff Rd, Lewisville, TX 75067
Off Market
Zillow last checked:
Listing updated:
Michael Law 0648528,
Dalton Wade, Inc. 727-888-4175
$534,600
$508,000 - $561,000
$4,369/mo
| Date | Event | Price |
|---|---|---|
| 6/1/2026 | Listed for sale | $549,900+53.2%$227/sqft |
Source: NTREIS #21287623 Report a problem | ||
| 4/26/2021 | Sold | -- |
Source: Agent Provided Report a problem | ||
| 4/21/2021 | Pending sale | $359,000$148/sqft |
Source: NTREIS #14554368 Report a problem | ||
| 4/16/2021 | Listed for sale | $359,000+56.1%$148/sqft |
Source: NTREIS #14554368 Report a problem | ||
| 7/15/2013 | Sold | -- |
Source: Agent Provided Report a problem | ||
| 6/8/2013 | Listed for sale | $230,000+7%$95/sqft |
Source: Keller Williams Realty #11966275 Report a problem | ||
| 6/8/2012 | Listing removed | $214,900$89/sqft |
Source: Ebby Halliday Realtors #11192534 Report a problem | ||
| 5/30/2012 | Listed for sale | $214,900$89/sqft |
Source: Ebby Halliday Realtors #11192534 Report a problem | ||
| 3/10/2012 | Listing removed | $214,900$89/sqft |
Source: Ebby Halliday Realtors #11192534 Report a problem | ||
| 2/25/2012 | Listed for sale | $214,900$89/sqft |
Source: Ebby Halliday Realtors #11192534 Report a problem | ||
| 10/9/2010 | Listing removed | $214,900$89/sqft |
Source: Ebby Halliday Realtors #11192534 Report a problem | ||
| 10/8/2010 | Listed for sale | $214,900$89/sqft |
Source: Ebby Halliday Realtors #11192534 Report a problem | ||
| 6/19/2009 | Sold | -- |
Source: Agent Provided Report a problem | ||
| 5/1/2009 | Listed for sale | $214,900$89/sqft |
Source: Active Website #11192534 Report a problem | ||
| Year | Property taxes | Tax assessment |
|---|---|---|
| 2025 | $7,747 -3.6% | $449,698 -3.3% |
| 2024 | $8,033 +1.9% | $464,842 +2.6% |
| 2023 | $7,880 -0.1% | $453,203 +9.1% |
| 2022 | $7,885 +19.4% | $415,524 +18.8% |
| 2021 | $6,603 +7.8% | $349,694 +8.9% |
| 2020 | $6,124 +2.5% | $321,083 +2.1% |
| 2019 | $5,973 +4.2% | $314,406 +6.9% |
| 2018 | $5,732 +12.4% | $294,032 +3.5% |
| 2017 | $5,099 | $284,000 +9.6% |
| 2016 | $5,099 +9.6% | $259,148 +5.7% |
| 2015 | $4,651 | $245,268 +10% |
| 2014 | $4,651 | $222,971 +8% |
| 2013 | $4,651 | $206,490 +4% |
| 2012 | -- | $198,625 -5% |
| 2011 | -- | $209,027 +8.2% |
| 2010 | -- | $193,150 -0.2% |
| 2009 | -- | $193,485 -1% |
| 2007 | $4,304 -2.3% | $195,392 +3.4% |
| 2006 | $4,407 +0% | $188,919 +0.1% |
| 2005 | $4,407 | $188,749 +2.2% |
| 2004 | -- | $184,773 -1.6% |
| 2003 | -- | $187,806 +1.3% |
| 2002 | -- | $185,469 +4.4% |
| 2001 | -- | $177,660 |
Find assessor info on the county website
Source: NTREIS. This data may not be complete. We recommend contacting the local school district to confirm school assignments for this home.
A local agent can set up tours, give advice and negotiate with sellers.


