Excelllent U of M housing option as a rental.
One block from Mannings Restaurant and Como Tap.
Convenient location if need to get on freeway also.
New furnace
New water heater
Big backyard with firepit
All hardwood floors.
Active
$329,000
2301 Cole Ave SE, Minneapolis, MN 55414
5beds
2,100sqft
Single Family
Built in 1900
4,791 Square Feet Lot
$-- Zestimate®
$157/sqft
$-- HOA
What's special
All hardwood floorsBig backyard with firepit
- 25 days
- 303
- 10
Zillow last checked:
Listing updated:
Listed by:
Moe Mossa 888-490-1268,
Savvy Avenue, LLC
Source: NorthstarMLS as distributed by MLS GRID,MLS#: 7150702
Facts & features
Interior
Bedrooms & bathrooms
- Bedrooms: 5
- Bathrooms: 3
- Full bathrooms: 1
- 1/2 bathrooms: 1
- 1/4 bathrooms: 1
Heating
- Forced Air
Cooling
- Window Unit(s)
Appliances
- Included: Cooktop, Dishwasher, Dryer, Exhaust Fan, Range, Refrigerator
Features
- Basement: Drainage System
- Has fireplace: No
Interior area
- Total structure area: 2,450
- Total interior livable area: 2,100 sqft
- Finished area above ground: 2,100
- Finished area below ground: 0
Property
Parking
- Total spaces: 2
- Parking features: Detached Garage, Garage Door Opener
- Garage spaces: 2
- Has uncovered spaces: Yes
Accessibility
- Accessibility features: None
Features
- Levels: One and One Half
- Stories: 1.5
- Fencing: None
Lot
- Size: 4,791 Square Feet
- Dimensions: 40 x 125
- Features: Near Public Transit, Tree Coverage - Heavy, Zero Lot Line
Details
- Foundation area: 1450
- Parcel number: 1902923240028
- Zoning description: Residential-Single Family
Construction
Type & style
- Home type: SingleFamily
- Property subtype: Single Family
Materials
- Roof: Composition
Condition
- New construction: No
- Year built: 1900
Utilities & green energy
- Electric: Power Company: Xcel Energy
- Gas: Natural Gas
- Sewer: City Sewer/Connected
- Water: City Water/Connected
Community & HOA
HOA
- Has HOA: No
Location
- Region: Minneapolis
Financial & listing details
- Price per square foot: $157/sqft
- Tax assessed value: $175,800
- Annual tax amount: $2,865
- Date on market: 9/25/2026
Estimated market value
Not available
Estimated sales range
Not available
Not available
Price history
| Date | Event | Price |
|---|---|---|
| 9/25/2026 | Listed for sale | $329,000+96.4%$157/sqft |
Source:  NorthstarMLS as distributed by MLS GRID #7150702 Report a problem | ||
| 6/30/2026 | Listing removed | $2,895$1/sqft |
Source: Zillow Rentals Report a problem | ||
| 5/17/2026 | Listed for rent | $2,895+3.6%$1/sqft |
Source: Zillow Rentals Report a problem | ||
| 3/13/2026 | Listing removed | $2,795$1/sqft |
Source: Zillow Rentals Report a problem | ||
| 3/1/2026 | Price change | $2,795+7.5%$1/sqft |
Source: Zillow Rentals Report a problem | ||
| 2/8/2026 | Price change | $2,600-5.5%$1/sqft |
Source: Zillow Rentals Report a problem | ||
| 11/4/2025 | Listed for rent | $2,750$1/sqft |
Source: Zillow Rentals Report a problem | ||
| 3/15/2025 | Listing removed | $2,750$1/sqft |
Source: Zillow Rentals Report a problem | ||
| 12/29/2024 | Listed for rent | $2,750$1/sqft |
Source: Zillow Rentals Report a problem | ||
| 8/30/2024 | Sold | $167,500-31.6%$80/sqft |
Source: NorthstarMLS as distributed by MLS GRID #6553296 Report a problem | ||
| 8/5/2024 | Pending sale | $244,900$117/sqft |
Source: NorthstarMLS as distributed by MLS GRID #6553296 Report a problem | ||
| 8/2/2024 | Price change | $244,900+14%$117/sqft |
Source: NorthstarMLS as distributed by MLS GRID #6553296 Report a problem | ||
| 7/31/2024 | Price change | $214,900-2.3%$102/sqft |
Source: NorthstarMLS as distributed by MLS GRID #6553296 Report a problem | ||
| 7/17/2024 | Price change | $219,900-2.2%$105/sqft |
Source: NorthstarMLS as distributed by MLS GRID #6553296 Report a problem | ||
| 7/9/2024 | Price change | $224,900-4.3%$107/sqft |
Source: NorthstarMLS as distributed by MLS GRID #6553296 Report a problem | ||
| 7/3/2024 | Price change | $234,900-4.1%$112/sqft |
Source: NorthstarMLS as distributed by MLS GRID #6553296 Report a problem | ||
| 6/13/2024 | Listed for sale | $244,900$117/sqft |
Source: NorthstarMLS as distributed by MLS GRID #6553296 Report a problem | ||
Public tax history
| Year | Property taxes | Tax assessment |
|---|---|---|
| 2026 | $2,865 +8.2% | $175,800 -5% |
| 2025 | $2,647 +3.5% | $185,100 +4% |
| 2024 | $2,558 +2.3% | $178,000 -9.2% |
| 2023 | $2,500 -15.4% | $196,000 +3.2% |
| 2022 | $2,953 -7.2% | $190,000 |
| 2021 | $3,183 +21.7% | $190,000 +0.3% |
| 2020 | $2,616 -17.8% | $189,500 +5% |
| 2019 | $3,183 +21.7% | $180,500 |
| 2018 | $2,616 +8.2% | $180,500 +24.5% |
| 2017 | $2,419 -3.4% | $145,000 +9.8% |
| 2016 | $2,504 -2.2% | $132,000 |
| 2015 | $2,561 +2.4% | $132,000 +5.2% |
| 2014 | $2,501 -1.3% | $125,500 +2.4% |
| 2013 | $2,534 -4.1% | $122,500 -3.9% |
| 2012 | $2,642 +5.9% | $127,500 -14.4% |
| 2011 | $2,494 +3.2% | $149,000 -10% |
| 2010 | $2,418 -37.8% | $165,500 -2.6% |
| 2009 | $3,887 +35% | $169,900 +11.9% |
| 2006 | $2,879 +4.9% | $151,800 +15% |
| 2005 | $2,743 +3.1% | $132,000 +15% |
| 2004 | $2,661 +5.1% | $114,800 +12% |
| 2002 | $2,532 -23% | $102,500 |
| 2001 | $3,288 | -- |
Find assessor info on the county website
Monthly payment
Est. payment
Payment breakdown
Explore the cost of this home by adjusting the details. Changes won't be saved.Climate risks
Neighborhood: Southeast Como


Similar homes
- $280,0005 bd2 ba1.7k sqft1176 14th Ave SE, Minneapolis, MN 55414For Sale
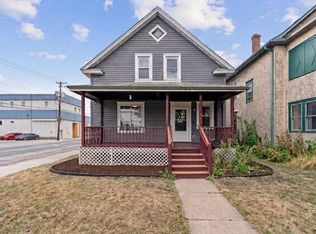
 MLS ID #7163167, Darci Smith, Edina Realty, Inc.. NorthstarMLS as distributed by MLS GRID
- $319,0004 bd2 ba1.3k sqft1096 23rd Ave SE, Minneapolis, MN 55414For Sale
 MLS ID #7066899, Melissa M Genereux, Gener8 Group LLC. NorthstarMLS as distributed by MLS GRID
- $385,0004 bd3 ba1.9k sqft978 17th Ave SE, Minneapolis, MN 55414For Sale
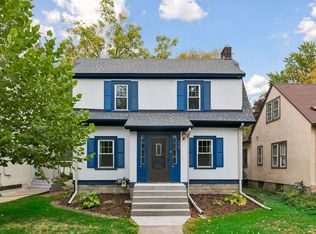 MLS ID #7161179, Bruce and Sue Wolf, Edina Realty, Inc.. NorthstarMLS as distributed by MLS GRID
- $319,9003 bd2 ba1.6k sqft862 21st Ave SE, Minneapolis, MN 55414For Sale
 MLS ID #7156978, Michelle L Skott Morgan, Coldwell Banker Realty. NorthstarMLS as distributed by MLS GRID
- $349,9005 bd2 ba1.5k sqft1157 14th Ave SE, Minneapolis, MN 55414For SaleMLS ID #7146877, Stephanie Hager, Bridge Realty, LLC. NorthstarMLS as distributed by MLS GRID
- $349,0006 bd3 ba2.1k sqft1076 25th Ave SE, Minneapolis, MN 55414For SaleMLS ID #7144995, Colin V Miller, RE/MAX Results. NorthstarMLS as distributed by MLS GRID
- $289,9004 bd2 ba1.5k sqft919 26th Ave SE, Minneapolis, MN 55414For SaleMLS ID #7147666, Collin Keith Anderson, RE/MAX Results. NorthstarMLS as distributed by MLS GRID
- $289,9095 bd2 ba1.4k sqft1004 26th Ave SE, Minneapolis, MN 55414For SaleMLS ID #7110543, Stephanie Hager, Bridge Realty, LLC. NorthstarMLS as distributed by MLS GRID
- $379,7006 bd2 ba2.2k sqft1077 26th Ave SE, Minneapolis, MN 55414For SaleMLS ID #7143548, Martin P. Morgan, Morgan And Trust Realty. NorthstarMLS as distributed by MLS GRID
- $325,0003 bd2 ba1.7k sqft1947 Johnson St NE, Minneapolis, MN 55418For SaleMLS ID #7160227, Delilah D Langer, Edina Realty, Inc.. NorthstarMLS as distributed by MLS GRID
- $374,9007 bd2 ba1k sqft2223 Cole Ave SE, Minneapolis, MN 55414For SaleMLS ID #7114699, Andy I Evuleocha, Coldwell Banker Realty - Southwest Regional. NorthstarMLS as distributed by MLS GRID
- $259,9503 bd2 ba1.2k sqft938 17th Ave SE, Minneapolis, MN 55414For SaleMLS ID #7157079, Jason Borowitz, Fish MLS Realty. NorthstarMLS as distributed by MLS GRID
- $350,0004 bd3 ba1.3k sqft2600 University Ave SE APT 210, Minneapolis, MN 55414For SaleMLS ID #7132834, Julie Hubbell, Julie Hubbell Real Estate. NorthstarMLS as distributed by MLS GRID
- $374,9004 bd2 ba1.4k sqft1720 Rollins Ave SE, Minneapolis, MN 55414For SaleMLS ID #7137930, Ken Hatfield, Keller Williams Premier Realty. NorthstarMLS as distributed by MLS GRID
- $365,0004 bd2 ba1.9k sqft1314 Lincoln St NE, Minneapolis, MN 55413For SaleMLS ID #7157711, Alicia Wendlandt, Dwell Realty Partners, LLC. NorthstarMLS as distributed by MLS GRID
- $380,0006 bd2 ba2k sqft1094 25th Ave SE, Minneapolis, MN 55414For SaleMLS ID #7154911, Michael Mitchell, Mitchell Realty LLC. NorthstarMLS as distributed by MLS GRID
- $410,0006 bd2 ba2k sqft827 Weeks Ave SE, Minneapolis, MN 55414For SaleMLS ID #7155599, Constance Campbell, Lifestyles. NorthstarMLS as distributed by MLS GRID
- $259,0002 bd1 ba1.1k sqft1040 24th Ave SE, Minneapolis, MN 55414For SaleMLS ID #7152762, Samuel Scott, National Realty Guild. NorthstarMLS as distributed by MLS GRID
- $400,0003 bd2 ba1.9k sqft820 5th Ave SE, Minneapolis, MN 55414For SaleMLS ID #7152477, Jim Shaw, Keller Williams Realty Diversified. NorthstarMLS as distributed by MLS GRID
- $299,9002 bd1 ba1.4k sqft612 5th St SE, Minneapolis, MN 55414For SaleMLS ID #7151067, Mike Garbart, RE/MAX Advantage Plus. NorthstarMLS as distributed by MLS GRID
