FREE information of properties that have been foreclosed on by the federal government and private lending institutions. Due to a very active local market, our inventory changes rapidly and photos are not always available. The procedure for dealing with institutional sellers is "different" so contact us TODAY to take advantage of these bargains. All measurements and taxes are e
Pre-foreclosure
Street View
Est. $409,600
2527 Abalone Blvd, Orlando, FL 32833
4beds
2baths
1,747sqft
SingleFamily
Built in 1991
10,800 Square Feet Lot
$409,600 Zestimate®
$234/sqft
$4/mo HOA
Overview
- 33 days
- 104
- 0
Facts & features
Interior
Bedrooms & bathrooms
- Bedrooms: 4
- Bathrooms: 2
Heating
- Forced air
Cooling
- Central
Interior area
- Total interior livable area: 1,747 sqft
Property
Parking
- Parking features: Garage
Lot
- Size: 10,800 Square Feet
Details
- Parcel number: 322301760248250
Construction
Type & style
- Home type: SingleFamily
Materials
- masonry
- Roof: Composition
Condition
- Year built: 1991
Community & HOA
HOA
- Has HOA: Yes
- HOA fee: $4 monthly
Location
- Region: Orlando
Financial & listing details
- Price per square foot: $234/sqft
- Tax assessed value: $331,483
- Annual tax amount: $1,950
Foreclosure details
Estimated market value
$409,600
$385,000 - $430,000
$2,434/mo
Price history
| Date | Event | Price |
|---|---|---|
| 7/23/2008 | Sold | $155,000-2.5%$89/sqft |
Source: Public Record Report a problem | ||
| 5/19/2008 | Listed for sale | $159,000-31.8%$91/sqft |
Source: Homes.com Report a problem | ||
| 5/25/2005 | Sold | $233,000+89.4%$133/sqft |
Source: Public Record Report a problem | ||
| 3/16/2000 | Sold | $123,000+14%$70/sqft |
Source: Public Record Report a problem | ||
| 3/20/1997 | Sold | $107,900$62/sqft |
Source: Public Record Report a problem | ||
Public tax history
| Year | Property taxes | Tax assessment |
|---|---|---|
| 2024 | $1,950 +7.8% | $133,030 +3% |
| 2023 | $1,808 +4.9% | $129,155 +3% |
| 2022 | $1,724 +3.3% | $125,393 +3% |
| 2021 | $1,670 +1.2% | $121,741 +1.4% |
| 2020 | $1,650 +2% | $120,060 +2.3% |
| 2019 | $1,618 +1.1% | $117,361 +1.9% |
| 2018 | $1,601 | $115,173 -33.2% |
| 2017 | $1,601 +1.6% | $172,329 +3% |
| 2016 | $1,576 +1.9% | $167,245 +5.8% |
| 2015 | $1,546 -3.6% | $158,094 +28.6% |
| 2014 | $1,604 +2.1% | $122,937 +3.9% |
| 2013 | $1,571 +1% | $118,359 +12.2% |
| 2012 | $1,557 -7.4% | $105,443 -6.3% |
| 2011 | $1,681 -3.5% | $112,505 -5.7% |
| 2010 | $1,742 | $119,341 -21.1% |
| 2009 | -- | $151,265 -23.3% |
| 2008 | $3,583 -7.5% | $197,097 -9.8% |
| 2007 | $3,874 +0.4% | $218,475 +10.1% |
| 2006 | $3,859 +93.2% | $198,426 +31.1% |
| 2005 | $1,997 +8.8% | $151,361 +9.4% |
| 2004 | $1,835 -2.7% | $138,304 +5.8% |
| 2003 | $1,887 +6.6% | $130,725 +5.6% |
| 2002 | $1,770 -1.1% | $123,781 +15.5% |
| 2001 | $1,791 +21.7% | $107,179 +13.2% |
| 2000 | $1,471 | $94,711 |
Find assessor info on the county website
Monthly payment
Climate risks
Neighborhood: Wedgefield

Similar homes
- $440,0004 bd3 ba2.5k sqft2405 ABALONE BOULEVARD, ORLANDO, FL 32833For Sale
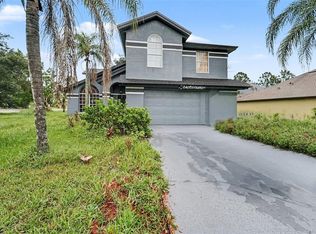
 MLS ID #O6433132, Vanessa Paul, MARK SPAIN REAL ESTATE. Stellar MLS
- $369,0003 bd2 ba1.4k sqft20828 MAXIM PARKWAY, ORLANDO, FL 32833For Sale
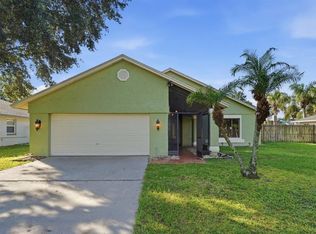 MLS ID #O6437358, Mayra Pinero, PA, KELLER WILLIAMS ADVANTAGE III. Stellar MLS
- $405,0003 bd3 ba1.9k sqft2233 ARDON AVENUE, ORLANDO, FL 32833For Sale
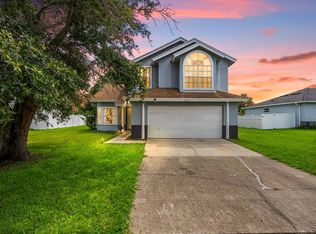 MLS ID #TB8537580, Chelsea Bruno, LPT REALTY, LLC. Stellar MLS
- $425,0003 bd2 ba1.9k sqft2208 ARCHER BOULEVARD, ORLANDO, FL 32833For Sale
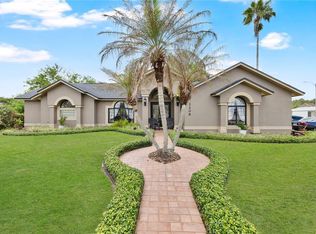 MLS ID #O6403463, Monica Cuervo, LPT REALTY, LLC. Stellar MLS
- $385,0003 bd2 ba1.4k sqft20446 MACON PARKWAY, ORLANDO, FL 32833For SaleMLS ID #O6415025, Trevin Perez, REDFIN CORPORATION. Stellar MLS
- $299,0003 bd2 ba1.7k sqft20604 MAXIM PARKWAY, ORLANDO, FL 32833For SaleMLS ID #O6449906, Victor Valentin, MARK SPAIN REAL ESTATE. Stellar MLS
- $365,0004 bd2 ba1.7k sqft19500 GLEN ELM WAY, ORLANDO, FL 32833For SaleMLS ID #O6388357, Brandi Tropf, EXP REALTY LLC. Stellar MLS
- $450,0003 bd2 ba2k sqft2240 BAGDAD AVENUE, ORLANDO, FL 32833For SaleMLS ID #O6389471, Yadelis Pena, C&D INTERNATIONAL REAL ESTATE. Stellar MLS
- $345,0003 bd2 ba1.5k sqft2421 ARCHER BOULEVARD, ORLANDO, FL 32833For SaleMLS ID #O6374415, Steven Koleno, BEYCOME OF FLORIDA LLC. Stellar MLS
- $500,0003 bd3 ba2.2k sqft2608 LYNDSCAPE STREET, ORLANDO, FL 32833For SaleMLS ID #O6447173, Carl Van Wesep, CHARLES RUTENBERG REALTY ORLANDO. Stellar MLS
- $424,9003 bd2 ba1.7k sqft14226 BRADBURY ROAD, ORLANDO, FL 32828For SaleMLS ID #O6448599, Millie Brockmeyer, RE/MAX INNOVATION. Stellar MLS
- $300,0003 bd3 ba1.6k sqft20630 MAXIM PARKWAY, ORLANDO, FL 32833For SaleMLS ID #O6439198, Jeanne McKnight, LPT REALTY, LLC. Stellar MLS
- $340,0003 bd3 ba1.7k sqft2649 ALBION AVENUE, ORLANDO, FL 32833For SaleMLS ID #O6363677, Elizabeth Quinones, EXP REALTY LLC. Stellar MLS
- $415,0004 bd2 ba2k sqft15319 MONTESINO DRIVE, ORLANDO, FL 32828For SaleMLS ID #O6445903, Miguel Rivera, LIFESTYLE INTERNATIONAL REALTY. Stellar MLS
- $420,0004 bd2 ba1.9k sqft14475 JAMAICA DOGWOOD DRIVE, ORLANDO, FL 32828For SaleMLS ID #O6428612, Gisela Gaztambide Balzac, EMPIRE NETWORK REALTY. Stellar MLS
- $539,0004 bd3 ba2.3k sqft2228 BANCROFT BOULEVARD, ORLANDO, FL 32833For SaleMLS ID #O6423712, Brian LeMay, ROMAN REALTY GROUP, LLC. Stellar MLS
- $419,9003 bd2 ba1.5k sqft3919 PEPPERVINE DRIVE, ORLANDO, FL 32828For SaleMLS ID #O6436544, John Alexandrou, AVALON REALTY GROUP LLC. Stellar MLS
- $399,0004 bd2 ba1.8k sqft2015 CORNER SCHOOL DRIVE, ORLANDO, FL 32820For SaleMLS ID #O6408229, Tony Ubaldini, EXP REALTY LLC. Stellar MLS
- $449,9903 bd2 ba1.8k sqft14167 BRADBURY ROAD, ORLANDO, FL 32828For SaleMLS ID #O6445961, Alberto Rivera, INNOVATION GROUP REALTY LLC. Stellar MLS
