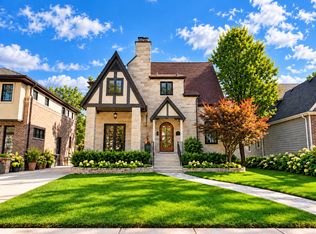
$1,200,000
-- bd-- ba1.4k sqft
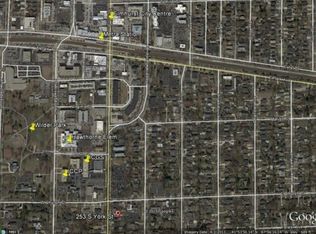
253 S York St, Elmhurst, IL 60126
Off Market
Listing description withheld by the listing agent.
Zillow last checked:
Listing updated:
Tiffany Nordahl 630-935-6131,
Weichert, Realtors - All Pro

Not available
Estimated sales range
Not available
Not available
| Date | Event | Price |
|---|---|---|
| 10/5/2026 | Price change | $850,000+0.6%$377/sqft |
Source:  MRED as distributed by MLS GRID #12752324 Report a problem | ||
| 10/4/2026 | Listed for sale | $845,000$374/sqft |
Source: MRED as distributed by MLS GRID #12752324 Report a problem | ||
| 9/24/2026 | Contingent | $845,000$374/sqft |
Source: MRED as distributed by MLS GRID #12752324 Report a problem | ||
| 9/11/2026 | Listed for sale | $845,000$374/sqft |
Source: MRED as distributed by MLS GRID #12752324 Report a problem | ||
| Year | Property taxes | Tax assessment |
|---|---|---|
| 2025 | $13,034 +4.2% | $241,212 +7.9% |
| 2024 | $12,513 +8% | $223,634 +8.1% |
| 2023 | $11,583 +1.7% | $206,800 +4% |
| 2022 | $11,388 +2.6% | $198,800 +2.5% |
| 2021 | $11,099 +4.1% | $193,860 +2.2% |
| 2020 | $10,665 +2.3% | $189,610 +5.2% |
| 2019 | $10,427 -6.8% | $180,270 -5.9% |
| 2018 | $11,183 +2.3% | $191,510 +4.9% |
| 2017 | $10,927 +2.3% | $182,490 +6.2% |
| 2016 | $10,681 +1.2% | $171,910 +7.3% |
| 2015 | $10,556 -8.9% | $160,150 -0.8% |
| 2014 | $11,593 +1.1% | $161,430 -1.4% |
| 2013 | $11,471 +1.7% | $163,710 -6.2% |
| 2012 | $11,282 +4.8% | $174,470 -7.9% |
| 2011 | $10,770 +2.1% | $189,430 -6.8% |
| 2010 | $10,553 +2% | $203,270 -6.8% |
| 2009 | $10,347 +6.1% | $218,090 |
| 2008 | $9,748 +5% | $218,090 +8.8% |
| 2007 | $9,286 +5% | $200,450 +10.1% |
| 2006 | $8,842 +7.7% | $182,110 +10.6% |
| 2005 | $8,208 +10.4% | $164,590 +6.3% |
| 2004 | $7,436 +3.9% | $154,840 +10.1% |
| 2003 | $7,155 +40.2% | $140,630 +49.6% |
| 2002 | $5,103 +7% | $94,000 +8.8% |
| 2001 | $4,767 +3.3% | $86,430 +5.2% |
| 2000 | $4,613 | $82,150 |
Source: MRED as distributed by MLS GRID. This data may not be complete. We recommend contacting the local school district to confirm school assignments for this home.
A local agent can set up tours, give advice and negotiate with sellers.
A local lender can help you make sure your offer is ready when you are.