$235,400
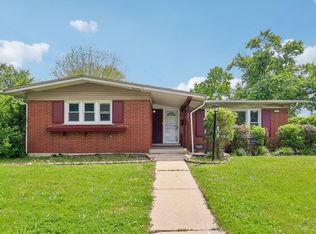
3 bd|1 ba|1.1k sqft
2853 190th Pl, Lansing, IL 60438
Off Market
Likely to sell faster than
Zillow last checked:
Michael Tootelian 847-502-5821,
BAAN Properties, LLC,
Sundae Williams 708-769-0255,
BAAN Properties, LLC
Not available
Estimated sales range
Not available
Not available
| Date | Event | Price |
|---|---|---|
| 5/22/2026 | Price change | $315,000-1.5%$186/sqft |
Source: | ||
| 1/5/2025 | Listed for sale | $319,900+60%$189/sqft |
Source: | ||
| 7/19/2023 | Contingent | $200,000$118/sqft |
Source: | ||
| 4/27/2023 | Listed for sale | $200,000$118/sqft |
Source: | ||
| 4/16/2023 | Contingent | $200,000$118/sqft |
Source: | ||
| 3/29/2023 | Listed for sale | $200,000+14.3%$118/sqft |
Source: | ||
| 8/12/2022 | Contingent | $175,000$103/sqft |
Source: | ||
| 8/1/2022 | Listed for sale | $175,000+1.7%$103/sqft |
Source: | ||
| 8/13/2013 | Sold | $172,000-1.1%$102/sqft |
Source: | ||
| 5/31/2013 | Pending sale | $174,000$103/sqft |
Source: Ryan Hill Realty, LLC #08297426 Report a problem | ||
| 5/25/2013 | Listed for sale | $174,000+132%$103/sqft |
Source: Ryan Hill Realty, LLC #08297426 Report a problem | ||
| 12/5/2012 | Sold | $75,000-19.5%$44/sqft |
Source: | ||
| 9/27/2012 | Price change | $93,200-4.9%$55/sqft |
Source: Realty Executives Target #08144191 Report a problem | ||
| 8/24/2012 | Listed for sale | $98,010-53.3%$58/sqft |
Source: Realty Executives Target #08144191 Report a problem | ||
| 5/4/2005 | Sold | $210,000+44.8%$124/sqft |
Source: Public Record Report a problem | ||
| 6/23/1994 | Sold | $145,000$86/sqft |
Source: Public Record Report a problem | ||
| Year | Property taxes | Tax assessment |
|---|---|---|
| 2024 | -- | $25,001 +0% |
| 2023 | $10,664 +27.2% | $24,999 +75.1% |
| 2022 | $8,383 +3.7% | $14,279 |
| 2021 | $8,080 +44.5% | $14,279 |
| 2020 | $5,591 -11.8% | $14,279 -12.8% |
| 2019 | $6,340 -2.6% | $16,379 |
| 2018 | $6,509 +1.7% | $16,379 |
| 2017 | $6,402 +12.6% | $16,379 +14% |
| 2016 | $5,687 -14.8% | $14,363 |
| 2015 | $6,673 +2.4% | $14,363 |
| 2014 | $6,517 +17.2% | $14,363 -11% |
| 2013 | $5,561 +1.8% | $16,137 |
| 2012 | $5,461 +3.9% | $16,137 |
| 2011 | $5,258 -1.1% | $16,137 -18.5% |
| 2010 | $5,317 +11.3% | $19,788 |
| 2009 | $4,778 +13.7% | $19,788 -5% |
| 2008 | $4,203 +1.6% | $20,830 +10.9% |
| 2007 | $4,138 +5.2% | $18,776 |
| 2006 | $3,932 +7.2% | $18,776 |
| 2005 | $3,669 -0.8% | $18,776 +17.9% |
| 2004 | $3,700 +5% | $15,924 |
| 2003 | $3,522 +3% | $15,924 |
| 2002 | $3,418 +8.7% | $15,924 +7.8% |
| 2001 | $3,144 +2.3% | $14,773 |
| 2000 | $3,074 +0.9% | $14,773 |
| 1999 | $3,046 | $14,773 |
Find assessor info on the county website
Source: MRED as distributed by MLS GRID. This data may not be complete. We recommend contacting the local school district to confirm school assignments for this home.
A local agent can set up tours, give advice and negotiate with sellers.